

Why Your Solar Feed-In Tariff Is Lower Than Your Electricity Usage Tariff

To understand why solar feed-in tariffs are comparatively low, you need to understand how your electricity bill sausage is made. Image credit
In this article, I am going to take a typical electricity bill and break it down into its components.
I told Finn I was doing this for two sensible reasons:
- To let people know where their electricity dollar goes.
- To show where solar feed-in tariffs come from and why they are significantly less than electricity’s retail price.
But the main reason is I hate electricity bills and enjoy breaking them into pieces.
By the time I’m done, you should have a good idea of how many different buckets your electricity money gets thrown into and roughly what portion each one gets. I’ll also show that energy fed into the grid from rooftop solar panels is worth more than just the wholesale price of electricity at that time — but, regrettably, still considerably less than the retail price of electricity.
The National Electricity Market
In this article, I’ll focus on the National Electricity Market or NEM. This covers all the states except Western Australia while including the Australian Capital Territory and also Jervis “nobody knows I’m a Territory” Bay. The Northern Territory and pretty much every other territory is left out. Especially the Australian Antarctic Territory, which will join the NEM when hell freezes over. Or unfreezes over as the case may be.
What You Pay For Electricity Now
Here’s what households currently pay for grid electricity in cents per kilowatt-hour in the NEM capitals. This is based on a home with a standard tariff that uses an average of 14 kilowatt-hours of grid electricity a day, which is 5,110 kilowatt-hours a year:
- Adelaide: 38.4
- Brisbane: 26.5
- Canberra: 26
- Hobart: 33.4
- Melbourne: 28.6
- Sydney: 29.2
I got these figures by looking up the lowest cost Origin Energy plan available in each city. As Origin is the nation’s largest electricity retailer, these prices should be reasonably representative of what people pay. The exception was Hobart. Tasmania only has two electricity retailers and neither of them is Origin, so I chose Aurora as they’re the most widely used.
If these prices seem high it’s because I included the daily supply charge, which usually makes up at least a quarter of household electricity bills and significantly increases the total cost of grid electricity per kilowatt-hour.
Average NEM Price
If I average the city capital prices above after weighting them by the population of the state or territory, it gives me an estimate for the average residential price of electricity in the NEM for a home averaging 14 kilowatt-hours of grid consumption per day:
- 29.2 cents per kilowatt-hour
Conveniently, that’s the same as in Sydney. While this is less than what households pay in Europe it’s nothing to boast about, given our lower taxation and generation costs, not to mention the fact our grid isn’t as reliable as in most developed countries that aren’t the United States.
The Seven Electricity Bill Components
I’ve listed the seven main components of electricity bills below. I think my breakdown makes sense, but it possible to separate it out into more parts or lump some together, so if other people do it differently it doesn’t necessarily mean I’ve left out steps or added extra ones for fun.
The seven main components of electricity bills, with very brief descriptive phrases, are:
- Wholesale Prices — Make it.
- Long Distance Transmission — Take it.
- Local Distribution — Break it down for local use.
- Metering — Measure it.
- Environmental Protection — Reduce damage.
- Retailing — Sell it.
- GST — Tax it.
A brief explanation for each:
Wholesale Prices: This is what large scale generators — such as coal power stations and large solar farms — are paid for supplying energy to the grid. What they receive can be set by a contract or they can sell it on the wholesale electricity market at whatever price is available at that spot in time. This is called the spot price.
Long Distance Transmission: High voltage transmission lines transport energy from large scale generators to towns and suburbs. The cost of building this infrastructure has to be paid for and the considerably lower cost of maintaining it has to be shelled out for as well.
Local Distribution: This is the distribution of electricity to homes and businesses locally using substations and poles and wires. This is handled by Distributed Network Service Providers (DNSPs).
Metering: The cost of reading electricity meters. This was done by humans but they are gradually being replaced by smart meters that automatically transmit the information. This — along with excessive charges for people who refuse smart meters — means the cost of metering should be falling.
Environmental Protection: There are four schemes designed to reduce the harm caused by the electricity sector. They work by encouraging the growth of renewable energy, improving efficiency, or doing things such as making sure coal power stations don’t let their ash blow all over the place. The schemes are:
- The Large Scale Renewable Energy Target or LRET: This provides a financial incentive for large scale new renewable generation such as solar and wind farms. This incentive is expected to rapidly decline over the next few years.
- The Small-scale Renewable Energy Scheme or SRES: This is often called the “solar rebate” and pays for STCs that lower the cost of new rooftop solar. It also lowers the cost of solar and heat pump hot water systems. This scheme is being gradually phased out over the next 10 years.
- Energy Efficiency Schemes: These programs are designed to reduce waste.
- Jurisdictional schemes: States and territories have various laws and schemes in place to protect the environment. These can be funded through fees as well as fines. Any fees and fines levied on the electricity sector generally end up being added onto the cost of electricity.
Retailing: Retailers are paid for sending electricity bills, receiving payments, dealing with customer inquiries, and convincing people to use them rather than another retailer.
GST: We have a 10% Goods and Services tax. This is less than most developed countries tax their electricity.
Environmental Protection
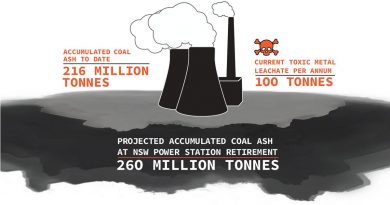
While our electricity bills pay for some environmental protection costs, these are not nearly enough to cover the complete toll the health and environmental externalities1 of fossil fuel generation. This means the real cost of grid electricity is higher than what we are charged on our electricity bills because we pay for it in other ways. I won’t go into externalities in this article, but these additional costs are real and shouldn’t be forgotten.
Unfortunately, our existing environmental protection costs are levied in a dumb way, as they are applied to all metered generation regardless of how clean it is and not mainly on the energy source that causes the most harm — which is coal.
Average NEM Electricity Bill Breakdown
I will provide a breakdown of the average electricity bill for the NEM. Because no one has a very large and odd-shaped residential property that extends into all the states and territories of the National Electricity Market, this isn’t going to represent anyone’s actual bill. What it will do is show where the money most Australians use to pay household electricity bills goes on average.
My figures will only be an estimate. I not going to try to make them spot on for the following reasons:
- Some information, such as electricity contract prices, is secret and I’ve left my Mission Impossible spy kit at home.
- This year is unusual thanks to the pandemic and, with a bit of luck, it won’t be too long before the economy improves and this will put upward pressure on electricity prices, even though the long term trend will be downwards thanks to increasing renewable capacity.
- Making things precise means more work for me and that’s just not on.2
I will use the figures this AEMC (Australian Energy Market Commission) report predicted for this financial year. The average wholesale price they use is higher than it is at the moment, but I don’t think they can be blamed for not predicting the pandemic. The other values should more or less be correct, as according to this AEMO report the pandemic only reduced demand for grid electricity by 2%3 in the second quarter of the year. This skips the ‘Rona resurgence in Melbourne during the third quarter, but since things had improved in the rest of Australia by then I don’t think there would be any large change overall.
According to the AEMO, the wholesale electricity spot price in the NEM has averaged 5.3 cents per kilowatt-hour over the past 12 months. However, what people have been actually charged is closer to 8.8 cents. As far as I can tell, this is due to long term contracts causing the overall average wholesale price to be higher than the wholesale market spot price. Normally it’s the other way around with wholesale spot prices averaging a little higher than contract prices, but the pandemic has made things topsy-turvey.
If I use the 8.8 cent figure for the average wholesale electricity price while keeping the other figures the same as in the AEMC report, then the cost of electricity bill components in cents per kilowatt-hour are:
- Wholesale Prices: 8.8
- Long Distance Transmission: 2.2
- Local Distribution: 9.9
- Metering: 0.9
- Environmental Protection: 1.7
- Retailing: 3
- GST: 2.9
- Total: 29.2
If I change these values to percentages and put them in a delicious pie graph, we get this:
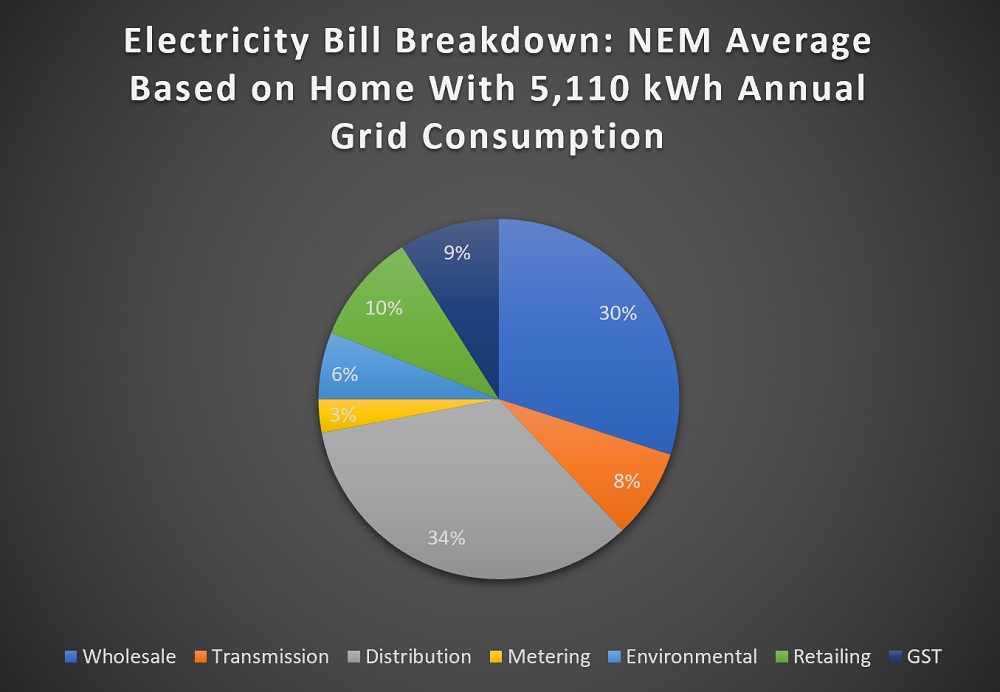
This lets us easily see local distribution takes the biggest bite out of electricity bills, followed by wholesale generation, with retailing in a distant third place.
Electricity Bill Components By State & Territory
While knowing the average for the NEM is interesting, it’s not very useful as the NEM average is a mythical place and no one actually lives there. What people really want to know are the electricity bill breakdowns for their state or territory and I’ve decided the easiest way to present the information is in a table. Sure, it may look like a wall of numbers, but if you are interested the information is all there:

These figures are from the AMEC report and I haven’t adjusted the wholesale component downward to reflect lower pandemic prices because I don’t have that information and can only give an estimate.4 In other words, I’ve decided to use figures for wholesale prices that I know are definitely wrong rather than guesstimate figures that probably would be wrong.
Solar Feed-In Tariffs & Electricity Bill Components
When your solar power system sends surplus electricity into the grid for other people to use it gets recorded on their electricity meters as grid consumption. They are charged the retail electricity price for it while the household that provided it receives a feed-in tariff.
Some components of electricity bills aren’t affected by the fact a kilowatt-hour of electricity came from a rooftop solar system and this is why feed-in tariffs are considerably less than the retail price of electricity. The costs of metering, retailing, and GST remain the same and still need to be paid. However, other bill components are eliminated or altered, which makes energy from rooftop solar power more valuable than energy from coal power stations, gas turbines, or large solar farms.
Wholesale Price: Energy provided to the grid is worth the wholesale price of electricity at the time it’s supplied. Solar power systems only generate during the day, so the average wholesale price solar receives will be different than the average wholesale price for all electricity. At the moment the average wholesale price received by solar energy generally isn’t far from the average, but it’s gradually trending down as increasing solar electricity production lowers prices during the day.
Long Distance Transmission: At the moment almost all energy fed into the grid from rooftop solar panels is consumed nearby, which eliminates the cost of long-distance transmission.
Local Distribution: For both long-distance transmission and local distribution, rooftop solar reduces strain on the grid when total demand is highest and this helps reduce costs. But as rooftop solar power expands, some changes to local distribution are required to accommodate it and — while modest in the great scheme of things — it is a real expense. The pros and cons of rooftop solar for local distribution is a complex topic and I won’t go into because I’d have to write at least a thousand words to get into the nitty-gritty details – and I’m feeling too thick to even think about it at the moment.
Environmental Protection: Providing clean energy is the entire point of having environmental protection charges, so it would be pretty dumb to apply them to energy from rooftop solar power systems, as it’s about as clean as it gets.
Fair Solar Feed-In Tariff Estimate
One way to make a quick estimate of what a fair feed-in tariff should be is to do the following:
- Take the average wholesale price energy from rooftop solar would receive through the day.
- Add the avoided cost of long-distance transmission.
- Add the effectively avoided costs of environmental protection.
- Not worry about anything else to keep things simple.
If you do this with the information for cost of different electricity bill components in the table above, you end up with a reasonable value even if you take the very cautious approach of halving the average wholesale price to allow for reductions caused by the pandemic and downward pressure on daytime electricity prices.
Victoria’s Solar Feed-In Tariff Determination
Only one state that comes close to following the rough and ready method I outlined above for determining solar feed-in tariffs – and that’s Victoria. The following table from this report shows a breakdown of the components of their minimum feed-in tariff for this financial year:
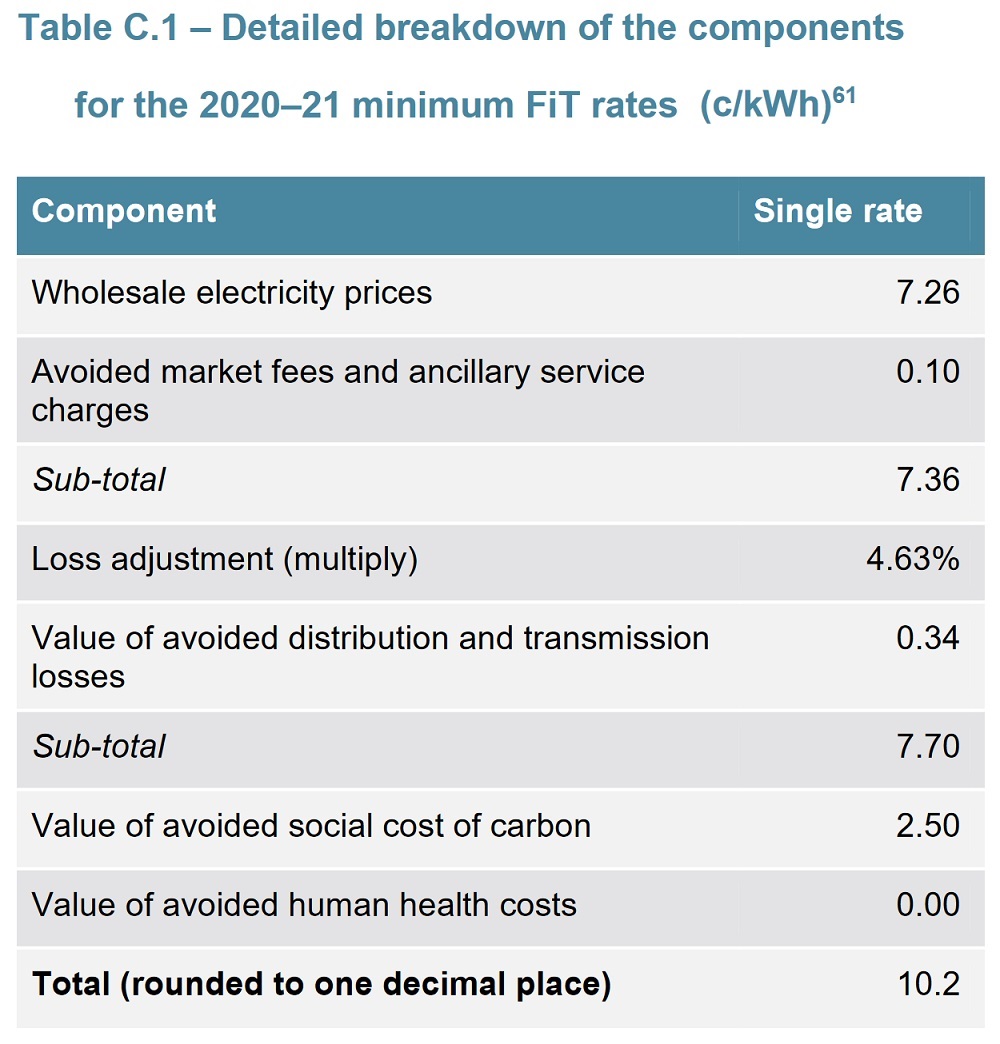
To cover the average wholesale price of energy provided to the grid by rooftop solar power systems, they allow 7.26 cents per kilowatt-hour. This is only 72% of the AEMC report’s prediction of 10.1 cents for the average wholesale price of electricity in Victoria this financial year.
While they allow for some avoided losses in transmission distribution, they don’t allow for rooftop solar power generally avoiding long-distance transmission altogether. It seems they think all generation has to contribute towards paying for the long lines.
Rooftop solar energy is also not let off the costs of environmental protections, but does receive 2.5 cents for “value of the avoided social cost of carbon” which is greater than the 1.8 cent per kilowatt-hour environmental protection costs in Victoria.
Rooftop Solar Energy Worth More Than Wholesale Prices
While energy from rooftop solar supplied to the grid is, unfortunately, not worth the retail price of electricity, it is worth more than whatever the wholesale price is at the time it’s fed into the grid. This is the case even if no allowance is made for the avoided health and environmental costs of fossil fuel generation.
This is a good thing, as daytime wholesale prices during will trend downwards in the future — even if they temporarily increase as the world economically recovers from the pandemic. But policymakers who set feed-in tariffs need to recognize energy from distributed solar power is worth more than just the wholesale price and ensure feed-in tariffs reflect that.
Footnotes
- An externality is a negative effect that the people causing don’t have to directly pay for. For example, coal generation doesn’t have to pay for the health costs of coal pollution.

- I won’t let my capitalist masters exploit me! I have read the works of Marx — both Groucho and Harpo. Workers of the world untie! You have nothing to lose but your knots!
- Note that even small changes in supply and/or demand can have major effects on wholesale electricity prices.
- The average wholesale market spot price over the past 12 months in cents per kilowatt-hour has been: NSW 6.4, QLD 4.8, SA 5.6, TAS 4.4, VIC 6.1. The average wholesale price households have been charged over this time has generally been around a couple of cents more.
Original Source: https://www.solarquotes.com.au/blog/solar-electricity-bill-breakdown/
Related Posts:
 Solar Owners: Shop Around For The Best Electricity Plan
 Federal Energy Rebates: Solar Households May Come Out Ahead
 Premium Feed Tariff & New Hot Water System?…
 Prepare For Even More Electricity Price Hikes
 Electricity Price Hike, Solar Feed-In Tariff Boost…
 Better Feed-In Tariffs For NSW Solar Owners
 Tasmania’s Solar Feed In Tariff Takes A Hit
 New Minimum VIC Solar Feed-In Tariffs Locked In


