Australian Solar Systems Interest Index: August 2021

While winter and COVID may be putting a dampener on life in general, there was still lots of interest in busting electricity bills with home solar power in July.
Solar Power System Capacity
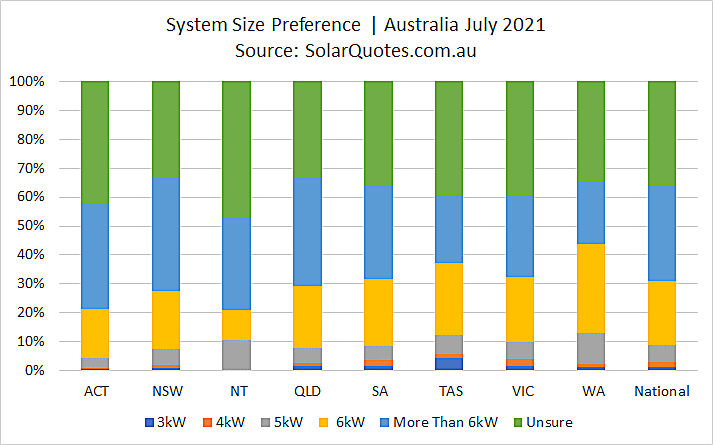
A little over 86% of Australians using SQ’s solar quotes service in July who had a system size in mind were after a 6kW system or bigger – around the same as in June. Among this group, approximately 52% were looking at larger than 6kW, down on June’s 56%. Around 36% of those using our service weren’t sure what capacity they needed and requested advice on solar system sizing.

Purchasing Intent
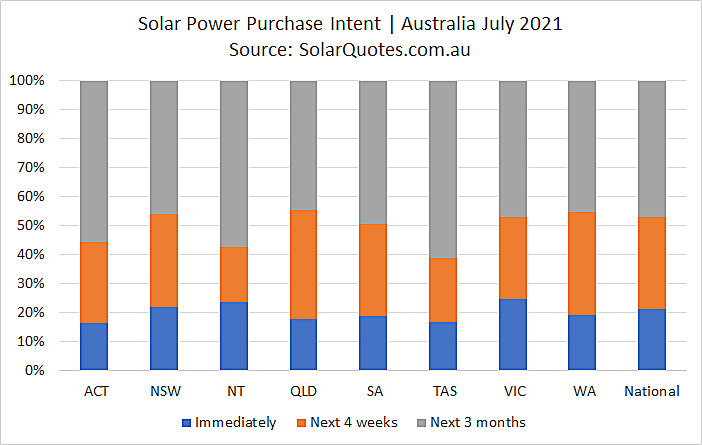
21% of all those who requested quotes were ready to buy a solar power system immediately; down from 29% in June and 22% in May. A whisker under 32% were looking to buy within 4 weeks and 47% within 3 months.
The drop in immediate purchase interest was largely attributable to a rush on the Victorian solar rebate in June, which reduced at the beginning of July. However, it remains a great deal; particularly given Victorians can also get the national “solar rebate“.

Price Vs. Quality
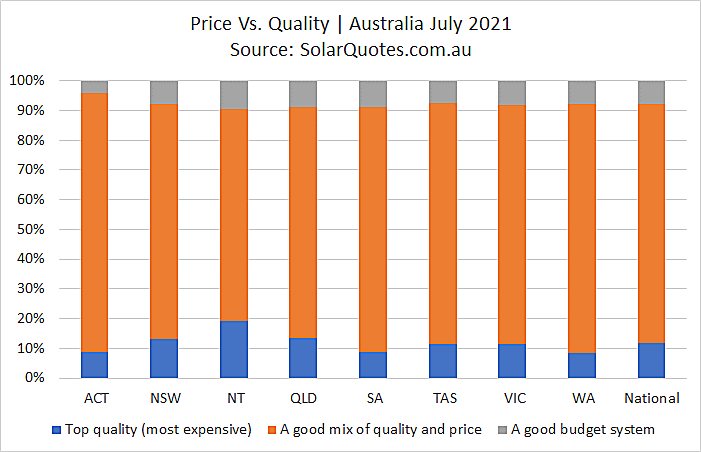
Just under 12% were interested in a “top quality” (most expensive) in July, up a little on June’s ~11%. 80% wanted a system providing a good balance of cost and quality, while around 8% were interested in a good quality budget system.

So, where do various brands generally sit on the pricing spectrum? You can see a chart for solar panels here and solar inverters here.
Australian Solar Price Index
On a related note, keep tabs on what’s happening with system prices in Australia with the SolarQuotes Australian Solar Price Index.
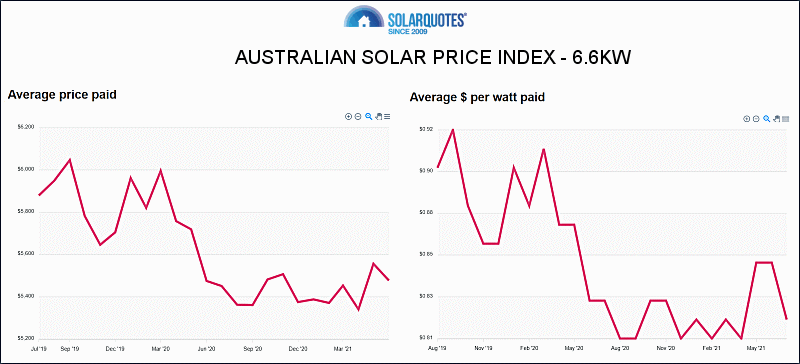
It displays the average price paid over time for rooftop installations across Australia and in individual states based on install date – and is updated in real time. Drill down for statistics on various system sizes, and specific panel and inverter brands.
Microinverter/Optimiser Interest
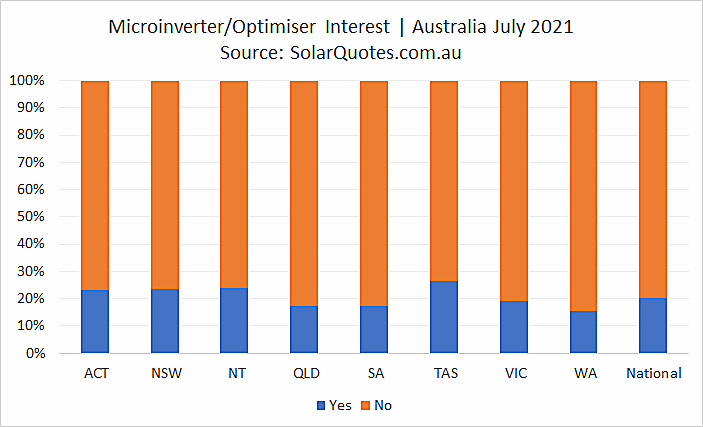
20% of enquirers in July expressed an interest in receiving information on adding microinverters or optimisers to a system, up on June’s 19%. You can find out more about microinverters and optimisers here.

Advanced Solar Monitoring
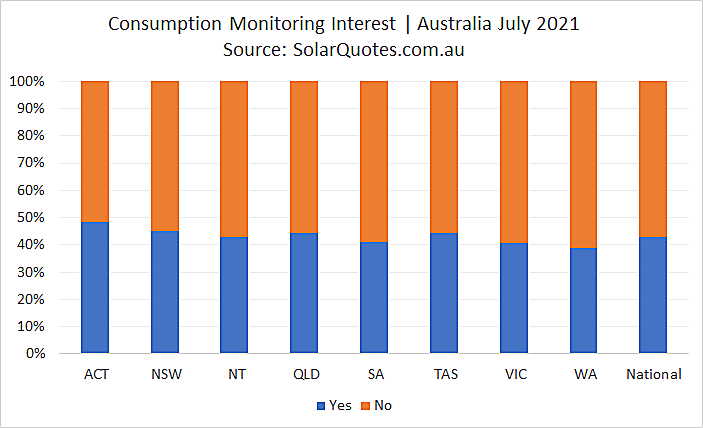
Advanced solar monitoring enables system owners to see how much electricity is being self-consumed in the home in addition to how much solar energy is being generated. While adding a few hundred dollars to a system purchase, it’s a very useful feature. Last month, a whisker under 42% expressed an interest in consumption monitoring.

Battery Ready Solar Systems
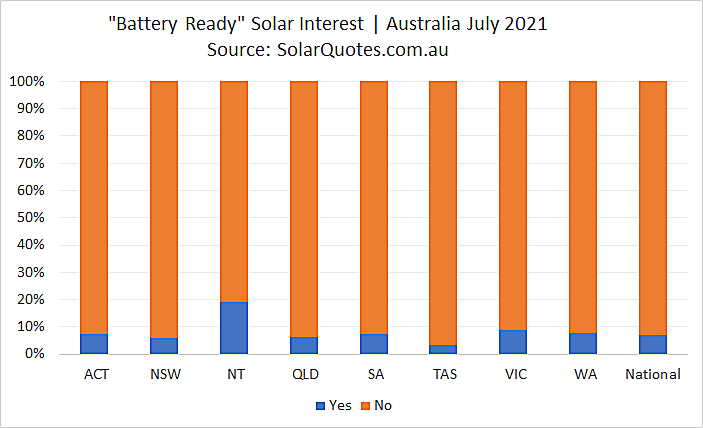
Once again in July, only 7% of quote requests indicated interest in a battery-ready package. While all solar systems are capable of having batteries added at a later date, informing an installer energy storage may be on the horizon can assist with system design.

Solar + Battery Installation
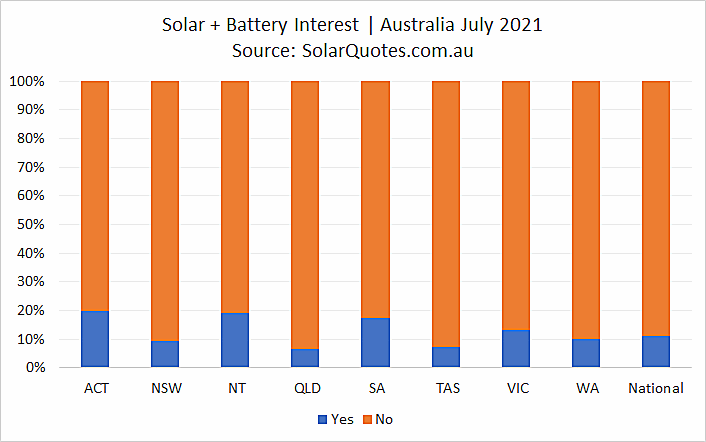
Around 11% (same as June) were interested in having a battery installed concurrently with a solar installation. The level of interest has remained between the 10% – 12% mark for at least the last 4 months.

If you’re considering a home battery, SQ’s solar and battery calculator is a very useful tool for estimating savings and payback – and it will also show you both for the panels and battery separately. Also check out our solar battery comparison table, where you can compare specifications of dozens of popular home energy storage systems.
Solar Battery Sizes
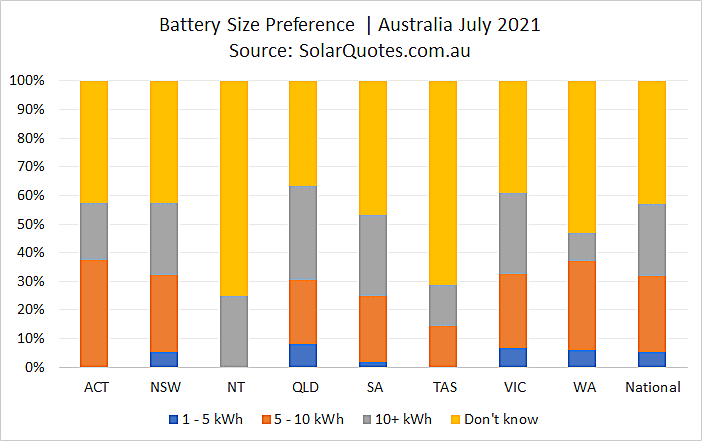
Where a battery installation was wanted with a new PV system and size specified:
- 1 – 5 kWh: ~9% (July ~7%, May ~11%)
- 5 – 10 kWh: ~46% (July ~48%, May ~44%)
- 10 kWh+: ~44% (July ~44%, May ~45%)

Main Battery Use
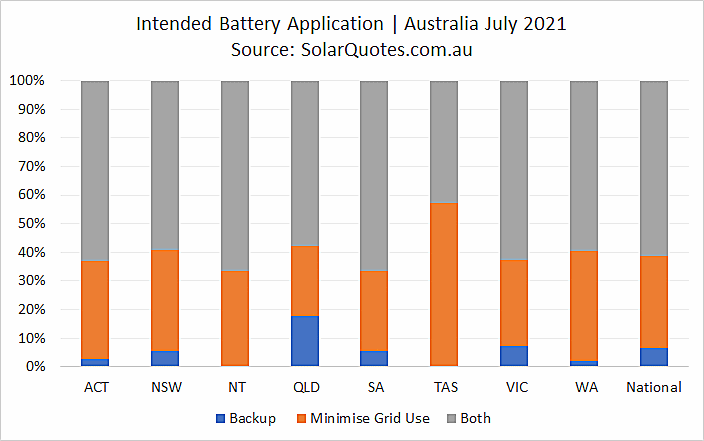
A little under 7% wanted a solar battery primarily for backup (6% in June, 7% in May, 4% in April), 32% for minimising mains grid electricity consumption (41% in June, 39% in May, 45% in April) and 61% indicated both applications.

Electricity Bills Before Solar
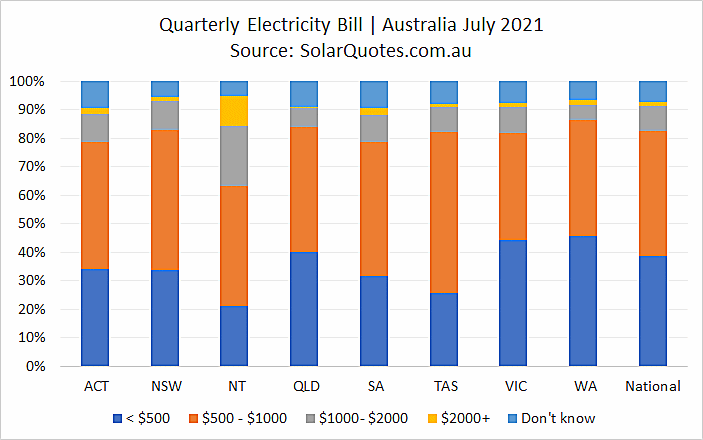
Around 47% of those who knew how much they were paying on their electricity bills noted between $500 and $1,000 on average per quarter – this has ranged between 45% and 47% for quite a while. What crept up in July was the proportion paying more than $1,000 a quarter – from around 9% in May and June to a little under 11% in July.

About The SQ auSSII Reports
Information in our auSSII reports is based on the content of quote requests from the thousands of Australians who utilise the SolarQuotes quoting service each month.
Superior Sales Leads For Solar Businesses
If your business wants solid sales leads from Australians eager to go solar – and you care about providing quality hardware, installation and customer support, let’s chat – find out more here.
Reproducing auSSII Report Content
You may reproduce content from this report on your web site – we only require you attribute it to SolarQuotes and reference this page.
Original Source: https://www.solarquotes.com.au/blog/aussii-solar-august21-mb2101/


