


Australian Rooftop Solar Power’s Rise Astounding, But..


Various headlines popping up around the place yesterday (and into today) might lead some to think the end of coal power in Australia is imminent. The enthusiasm for solar energy is great, but this isn’t quite the case.
An example was the ABC’s headline: “Rooftop solar poised to become Australia’s biggest power source amid coal’s demise”. The article discussed a report indicating there’s now more than 20,000 megawatts of small-scale solar capacity installed on Australian homes and business rooftops, and small-scale solar capacity will soon eclipse that of coal.
The ABC certainly wasn’t alone in overly-optimistic headlines.
20,000 MW (megawatts), or 20 GW (gigawatts)1, is a shedload of solar panels – and a lot of capacity in anyone’s books regardless of the generation source. And while it’s true the end of coal is (reasonably) nigh, we still have some way to go.
Rooftop Solar’s Contribution To Electricity Consumption
Comparing coal and solar power is not apples to apples when it comes to energy production2.
While a coal power plant can operate at nameplate capacity for long periods3, rooftop solar power systems don’t. Output from solar panels is of course limited to daylight hours. And output will depend on various factors during that period – among them time of day, weather, orientation/tilt of panels and more. Other factors include system oversizing (a very common and desirable practice) and export limits.
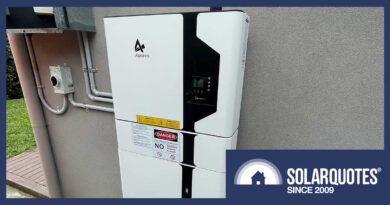
For example, I have a 10kW solar power system, but it has an 8kW inverter. This means in the best case scenario, my 10kW system can generate ~8kW of usable power. But added to this is my system is 5kW export limited. So, in a situation where the house is consuming very little electricity, it cranks a maximum 5kW – or thereabouts.
Rooftop solar power’s contribution to Australian electricity consumption is certainly growing, but it still dwarfs that of coal.
According to OpenNEM, rooftop solar accounted for 9.5% of electricity consumption in the NEM + SWIS4 in 2022. But coal (black and brown) power’s share was 55.9%. While renewables contributed 34.9% to consumption in Australia last year, which is very good news in itself, that was all renewables including solar (rooftop + utility), wind and hydro.
OK, But Does This *Really* Matter?
The 9.5% from rooftop solar last year is a big jump from just 5 years prior when it was only 3.2%. Coal power’s contribution has dropped from around 71% in 2017, so it has seen a big slide too and that will continue. But coal power, for now, still rules the roost.
This shouldn’t be forgotten, or allow pressure to ease up even just a little on fully kicking the filthy fossil fuel out the door as soon as realistically possible says SolarQuotes Founder Finn Peacock.
“Rooftop solar hitting 20 GW of installed capacity is great news and should be celebrated, but careless headlines and editorial implying – to anyone who’s not an energy nerd – that Australian rooftop solar now produces more electricity than coal is not helpful,” states Finn. “We need an informed population who understand both the great progress and huge amount of work ahead to rid our grid of coal.”
The ABC’s report mentions electricity generation share stats well into the article, but some readers will consider a headline accurately summarises a story and skim the rest – or not even bother skimming. This was evident in some of the social media posts that followed. And some of these have taken a life of their own, further distorting the facts.
Finn also discussed yesterday’s related media coverage with ABC Radio’s Nightlife’s Philip Clark last night as part of a segment on solar, batteries and EVs.
Footnotes
- Some of that total, albeit likely a small proportion, may be system replacements – i.e. there could be some “double counting”.

- Learn about the difference between power and energy.
- When it’s not breaking down, offline for scheduled maintenance or whatever
- “NEM” stands for National Electricity Market, which consists of Queensland, New South Wales, ACT, Victoria, Tasmania and South Australia. “SWIS” stands for South-West Interconnected System, which is Western Australia’s main electricity network.
Original Source: https://www.solarquotes.com.au/blog/australian-solar-coal-mb2846/
Related Posts:
 Fears Of EU Coal Power Rebound “Dead”
 Solar and Wind Eclipse Coal in U.S. Energy Mix
 Renewables covered 96% of new electrical capacity in…
 Regulator Takes A Punt On 2022 Rooftop Solar Figures
 Solar Panels To Help Power Tasmanian Irrigation Pumping
 Australian Rooftop Solar’s Contribution In 2024 Hits…
 Renewables produced 24% of US’s energy in first 10…
 Eclipse To Dim Australian Skies And Solar Energy Output


