Solar Panel Power Tolerance: What’s Hidden In The Fine Print?

I’m here to help you navigate the positives and negatives of solar panel power tolerances until you can tolerate no more. Is this just another obscure term in solar technology, or is it worth paying attention to? Let me explain…
Power Tolerance: A Simple Explanation
Power tolerance indicates how much a solar panel’s actual energy output might differ from its stated or rated power. This is measured under Standard Testing Conditions (STC) and can be expressed either as a percentage or in watts. In simpler terms, it tells you how much the panel’s performance might vary—either above or below what the manufacturer claims.
Pretty simple huh? Not quite.
Watts (W) vs Percentage (%)
When reading a solar panel data sheet to determine the power tolerance values, pay particular attention to the metric specified, and make sure to use the correct one. Power tolerances expressed as percentages give a totally different outcome than ones given in watts.
For instance, a -5%/+5% power tolerance indicates that the actual power output may vary by up to 5% of the rated power. With this tolerance, a 400 W panel may in fact be anywhere from 380 W to 420 W.
On the other hand, a -5/+5 W power tolerance means the panel output may be out by 5 watts on either side of its rated power. A 400 W panel, in this case, could be anywhere from 395 W to 405 W.
It’s easy to assume one or the other metric, so keep that in mind when quickly scanning through data sheets. It tripped me up on more than one occasion.
Join thousands receiving the latest solar, battery and EV news and views from SolarQuotes!

±5 % does not equal ±5 W. You won’t find this equation in the textbooks. It’s just a reminder.
On A Positive Note
Power tolerances don’t have to be a negative value. 0/+10 W is a very good specification. Of that, I’m positive. It’s much better than a spec of -10/+10 W. In fact, there has been a slow trend over the years for manufacturers to be specifying panels from zero upwards into positive territory.
It’s not uncommon to see a value of 0/+5 W, although more common to see -5/+5 W or -3%/+3%. You’d be hard-pressed to find a wider tolerance than that from a good quality solar panel.
It goes without saying (or does it?) that a tighter power tolerance is preferable. -3%/+3% is better than -5%/+5% as you’ve got more chance of getting what you paid for. Even better would be a positive value of, say 0/+10 W because, for solar power bigger is better, plus there’s a possibility of getting something for nothing. And who doesn’t like that?
But Wait, There’s More
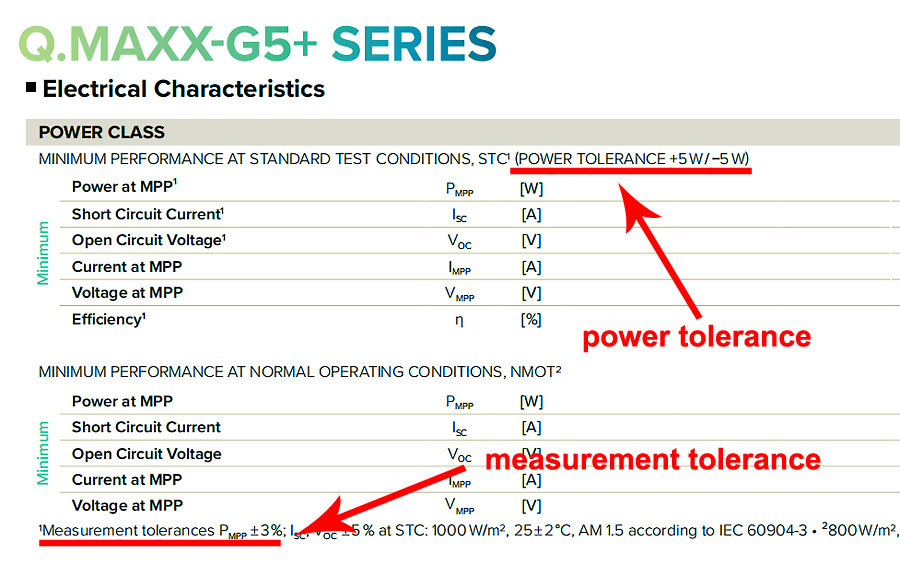
As usual, checking the fine print’s always a good idea. This one’s a doozy. Often further down the document, and hidden in small letters, you’ll find another specification called ‘measurement tolerance’. You might see something like ‘Measurement tolerances of Pma, Voc, and Isc ±3%’. This indicates the acceptable range of deviation from the specified or expected values in the measurements will be within plus or minus 3%.
The measurement tolerance of ±3% is pretty standard across the board for most solar panels but appears to create more uncertainties in an already uncertain world. Don’t panic, as it’s a level playing field for most solar panels in that regard. Even though, I’m going to talk about it.
If a solar panel data sheet specifies a power tolerance of ±3% and a measurement tolerance of ±3%, then the total for the power output would still be ±3%. If however, the power tolerance specified is 0/+3% and the measurement tolerance is ±3% then the total would also be ±3%, because the greater of the two figures should be used.
Should a consumer be concerned? No! Not at all. As I said, you can’t escape the measurement tolerance, so don’t give it a second thought.
What about a PV system designer? Hell yes! They should at least know about it, and take that into consideration when designing a system, guaranteeing the yearly output to their customers. This might not be as detailed as crunching numbers down to the nth degree. It’s more like designing conservatively and leaving a buffer that allows for specified tolerances. The design software may already factor this in.
Solar installers often walk the fine line between getting customers by promising them a particular yearly power output from their system and keeping them, by actually delivering that. If the expected yearly power output given in a quote seems unrealistically higher than others, the installer better be able to explain why.

QMaxx G5+ series datasheet showing power tolerance and measurement tolerance.
Solar Panel Power Tolerance And Warranty
Do you need to be concerned about power tolerances affecting the output of your system specified in your warranty? No! That’s your installer’s problem. As I said, a good solar system designer will consider tolerances when calculating the expected yearly output, and give you a conservative figure. Your warranty will be based on the rated system size, so it’s good news for you, and bad news for the installer if they’ve over-promised on the output.
Power Tolerances Are Getting Better
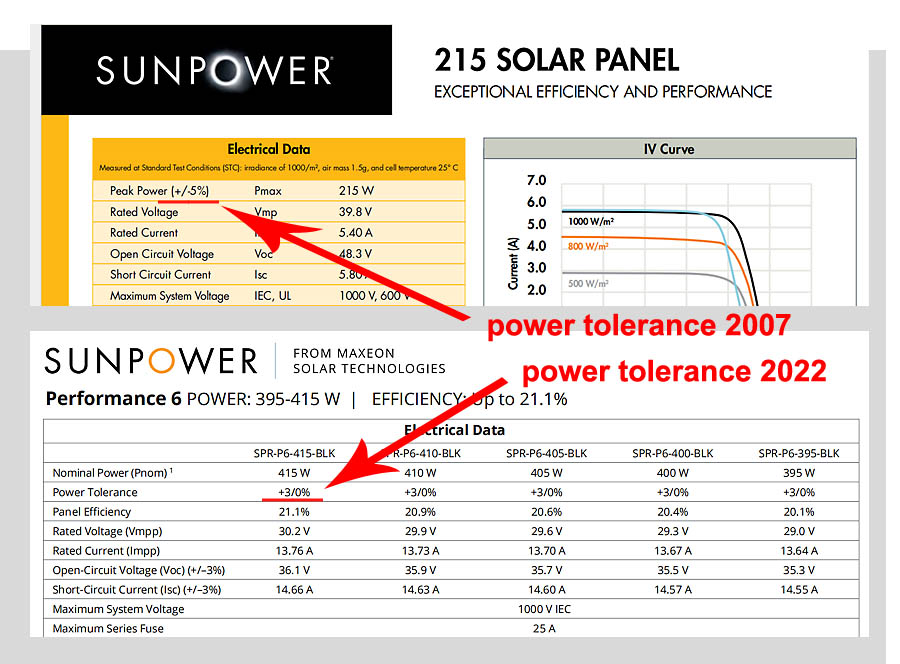
Power tolerances in solar panels have progressively gotten better in the short number of years they have been mass-manufactured. I’m told they were as wide as -10/+10% in the early years, although I’ve not seen a data sheet to qualify that figure. I can however show you the progress Sunpower has made over the last 15 years. In 2007, their Sunpower 215 series had a peak power tolerance of +/-5%, and in 2022 the Sunpower Maxeon series specified a power tolerance of +3/0%.
Why is this so? I think it’s a combination of many things. Industry standards, advancements in manufacturing technology, competition, and the explosion of the mass solar market, to name a few. Standards provide a framework for manufacturers to meet specific criteria, and advancements in technology help manufacturers meet these criteria. Competition drives them to exceed expectations, and it all snowballs as the market grows.

Old and new Sunpower data sheets. (Top) 2007 Sunpower 215 series power tolerance of +/-5%, (Bottom) 2022 Sunpower Maxeon series power tolerance of +3/0%.
How Tolerant Are You?
So that’s solar panel power tolerance. Should you worry about it? As a consumer, probably not too much. A narrow, or positive power tolerance does suggest a higher quality panel from a better factory but should be taken in context with all the other variables.
Should you worry about it as a PV designer/installer? Bloody oath! Given the possibility of power tolerances and measurement tolerances compromising a solar panel’s output, you should at least consider them when designing systems. It’s always best to under-promise and over-deliver.
Thank you for tolerating me.
Original Source: https://www.solarquotes.com.au/blog/solar-panel-power-tolerances/


