Australian Solar Prices: November 2021 Update


There’s been lots of talk about solar supply chain issues putting upwards pressure on system prices in Australia – here’s what we’ve been seeing on the ground (or more accurately, on the roof).
The following table indicates prices paid for systems (cost per watt) across all system sizes and after all rebates and subsidies in October compared to September, and also October 2020.
| State | Cost per watt (October 2021) |
Cost per watt (September 2021) |
Cost per watt (October 2020) |
| QLD | $0.90 | $0.88 | $0.93 |
| NSW | $1.01 | $1.01 | $0.95 |
| ACT | $1.12 | $1.29 | $1 |
| VIC | $0.88 | $0.88 | $0.78 |
| TAS | $1.08 | $1.14 | $1.10 |
| SA | $0.94 | $0.93 | $0.95 |
| WA | $0.76 | $0.81 | $0.75 |
| NT | NA | NA | NA |
| AU | $0.93 | $0.93 | $0.91 |
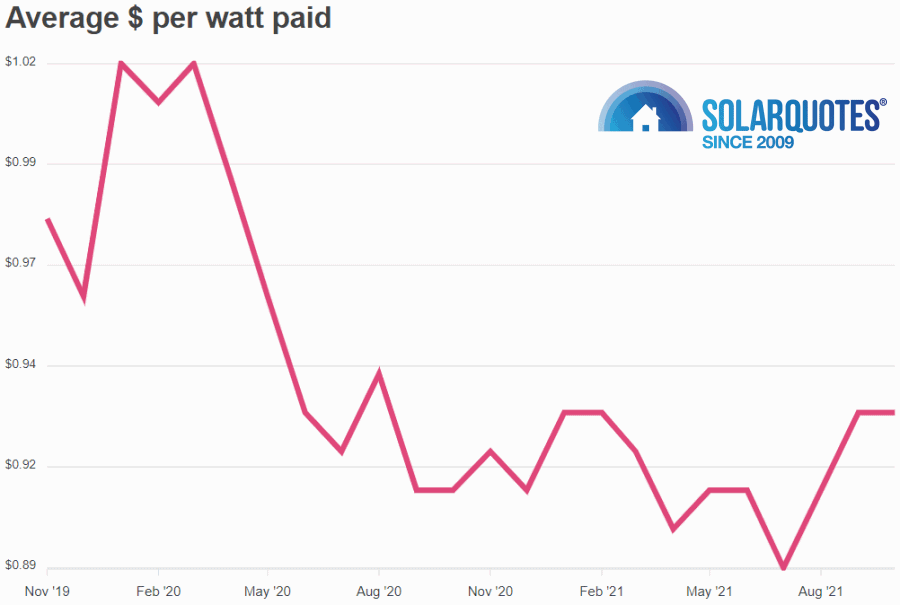
And here’s an updated graph of the national cost-per-watt picture (all system sizes) going back to October 2019:

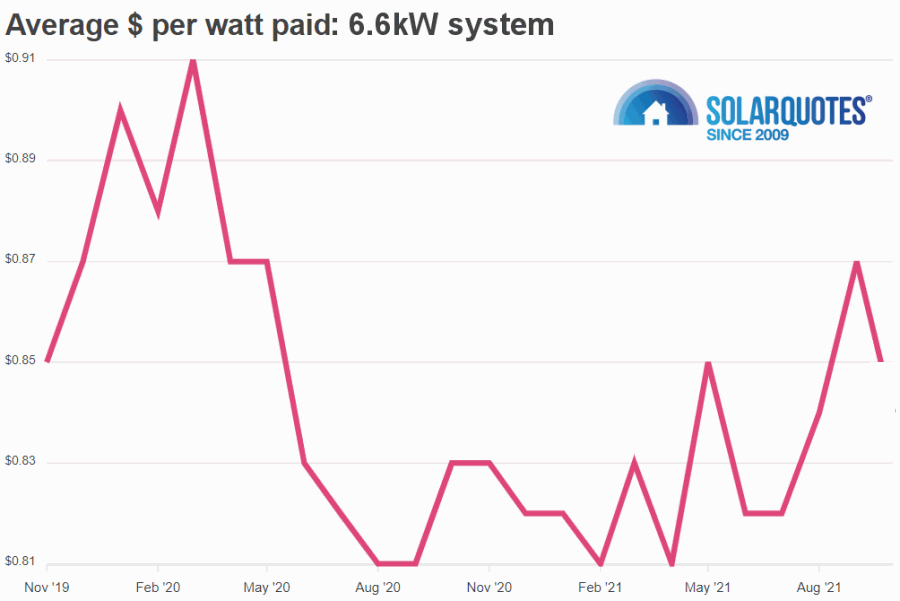
The following graph shows historical cost per watt pricing on 6.6kW solar systems, generally considered entry level these days:

This information is generated by the SolarQuotes Australian Solar Price Index, an interactive tool showing average prices for solar power system installations in each state and across Australia. For a more granular look at things, you can drill down for pricing on various system sizes and brands of solar panels and inverters.
The figures for October are sourced from Australians who have submitted solar installer reviews. These include reviews of installers not associated with the SQ network; so the quality of systems will vary. The figures noted above may change given the Index is updated as new reviews come in.
What’s Happening?
With the exception of Western Australia, ACT and Tasmania (and the latter two may be to do with how many records we have), pricing appeared reasonably stable between September and October under the circumstances – and also stacked up pretty well against October last year in some states.
But something to bear in mind is the cost of solar has generally been dropping, so change in that trend is evidence solar panel supply issues are having effects.
Some installers have also reportedly been grabbing whatever solar panels they can get their hands on. Perhaps some of the more commonly used well-known brands are being substituted for less popular cheaper brands, and how that will play out in the years ahead remains to be seen. If you’re buying a solar power system, pay special attention to the system components in any quotes – research the brands.
There has also been a trend of Australians buying increasingly larger systems such as 10kW – and bigger systems are generally cheaper in terms of cost per watt. But that said, it’s looking as though 10kW systems were pricier in October compared to September; while 6.6kW systems were cheaper.
As for when supply/cost issues will be fully addressed, we’ve heard everything from a very optimistic before year’s end to a rather pessimistic 2023.
What happens with pricing in November and December will be interesting as the solar rebate (actually an up-front discount) is set to reduce again on January 1. As the subsidy is partly based on when a system is installed and some installers are fully booked to the end of the year, pricing in quotes from these installers going forward will reflect that.
The Best Time To Buy Solar? Usually Now.
If you’re considering putting off installing panels for whatever reason, consider this:
Each quarter a household or business puts off an installation is another quarter of paying electricity bills much higher than they would otherwise be – and that can add up to a very significant sum, very quickly.
To keep tabs on the situation with the cost of solar in Australia and where it has been, check out the Australian Solar Price Index.
Original Source: https://www.solarquotes.com.au/blog/solar-prices-november-mb2248/


