Australian Solar Prices: February 2022 Update


Find out what Australians were paying for solar power systems last month in the latest SolarQuotes Australian Solar Prices Report.
The pandemic is continuing to have an effect on how much Australians are paying for solar panels. The following table shows average price per watt (all system sizes) fully installed after all rebates in January 2022, compared to December and January 2021.
| State | Cost per watt (January 2022) |
Cost per watt (December 2021) |
Cost per watt (January 2021) |
| QLD | $1.02 | $0.97 | $0.93 |
| NSW | $1.12 | $1.11 | $0.98 |
| ACT | NA | $1.26 | $1.08 |
| VIC | $1.04 | $0.99 | $0.84 |
| TAS | NA | $1.34 | $1.14 |
| SA | $0.97 | $1.01 | $0.94 |
| WA | $0.96 | $0.88 | $0.80 |
| NT | NA | NA | NA |
| AU | $1.04 | $1.02 | $0.93 |
The figures are generated by Solar Quotes’ Australian Solar Price Index, which shows historical pricing in each state and nationally. The tool has some pretty nifty features, including the ability to create reports on specific system sizes, panel and inverter brands.
January 2022’s results to date are based on information provided by 207 Australian solar buyers who when submitting installer reviews (including reviews of installers not in the SQ network) chose to indicate what they paid. The January results may change somewhat in the time ahead as new submissions are received and the graphs updated in real time.
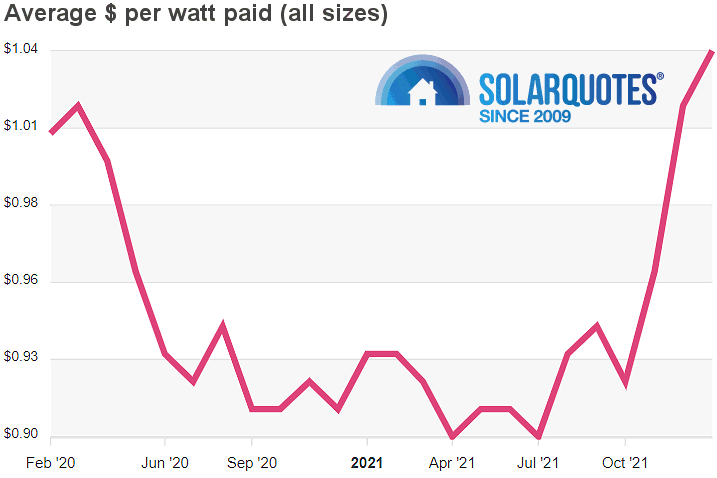
The following graph shows cost-per-watt – all system sizes and across Australia – going back to February 2020.

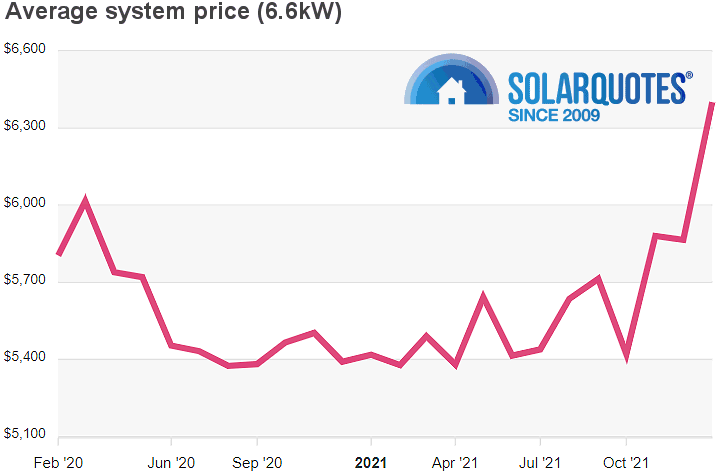
This graph indicates average historical cost of fully installed 6.6kW solar systems nationally over the same period.

In January, the cost per watt for 6.6kW increased in NSW to $1.03 (+5c), QLD to $1.07 ( +12c), VIC to 85c (+2c) and WA to 90c ( +18c). However, in South Australia there was a decrease to 91c (-4c). The increase in Western Australia was particularly large and Perth’s reputation of having the cheapest solar in Australia was challenged on the 6.6kW front by Victoria.
The race to the bottom on pricing in Western Australia is taking its toll. Last week, a long-established leading Perth solar installer announced it was getting out of the game, citing competition on pricing as a (if not the) factor in its decision.
Pandemic Pressures On Solar Pricing Persist
While the world for the most part appears to be making its way to the other side of the pandemic (touch wood), it’s going to take some time for supply chains to sort themselves out. Pricing for polysilicon, a material crucial in the manufacture of solar cells, remains high. While recent news of a stack more polysilicon production capacity is in the pipeline was well-received, it has to be producing first to have any effect.
Shipping costs are another particularly sore point. According to Statista, container freight rates (40-foot container) increased from around USD $1,446 in December 2019 to a peak of $10,839 in September last year – ouch. While the situation has improved somewhat compared to then ($9,800 in January), it’s still a far cry from pre-pandemic days.
Higher solar costs are disappointing for Australians considering purchasing systems, but installing solar panels remains a no-brainer for slashing electricity bills and payback will generally be quite rapid. Putting off a system purchase to wait for prices to drop (whenever that will be) only further locks a household into electricity bills higher than they would otherwise be.
Try SQ’s solar calculator to find how much you could be saving now by installing panels.
Original Source: https://www.solarquotes.com.au/blog/solar-prices-february22-mb2364/


