Australian Solar Prices: March 2022 Update


Discover how much Australians were paying for solar power systems during February in the latest SQ Australian Solar Price Report.
Average cost per watt increased for systems purchased in February 2022 compared to January in Queensland, the ACT, South Australia and Victoria; with New South Wales stable and a significant drop in Western Australia. As for Tasmania and the Northern Territory, we don’t have enough data as yet to make a useful comparison.
Here’s how the figures are looking for February at the time of writing.
| State | Cost per watt (February 2021) |
Cost per watt (January 2022) |
Cost per watt (February 2022) |
| QLD | $0.94 | $0.98 | $1.02 |
| NSW | $1.00 | $1.11 | $1.11 |
| ACT | $1.30 | $1.35 | $1.39 |
| VIC | $0.80 | $1.03 | $1.09 |
| TAS | $1.23 | NA | NA |
| SA | $0.89 | $1.03 | $1.09 |
| WA | $0.76 | $0.93 | $0.86 |
| NT | NA | NA | NA |
| AU | $0.93 | $1.03 | $1.03 |
This information is sourced from Solar Quotes’ Australian Solar Price Index, a handy tool indicating historical pricing in each state and nationally. The tool also has advanced filters enabling the creation of reports on specific system sizes, solar panel and inverter brands.
The results for February are based on details provided by 293 Australian solar buyers who chose to tell us what they paid when submitting solar installer reviews (including reviews of installers not in the SQ network). These results may change as new submissions are received as the graphs the tool generates are updated in real time.
Cost Per Watt In February 2022
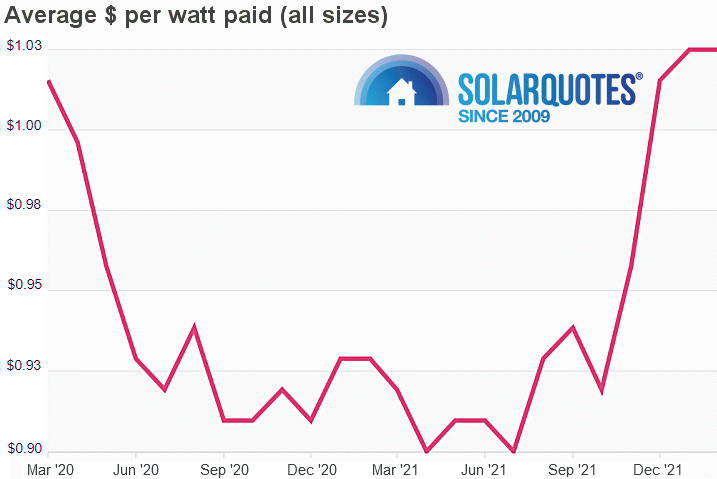
The following graph indicates fully installed system average cost-per-watt – across all system sizes nationally – going back as far as March 2020.

After quite a bump up in January 2022, average cost per watt pricing in Western Australia appears to have dropped to its lowest since December – but is still quite some way off from the lowest average we’ve seen in that state; 71c back in May last year. The comparatively low average prices in Western Australia are driven by the extremely competitive Perth market, which has recently seen the exit of at least one significant player due to pricing pressure.
6.6kW Solar System Pricing In February 2022
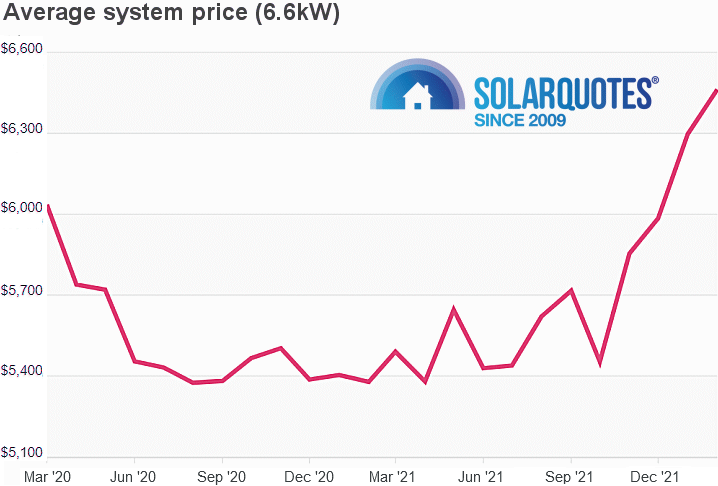
This graph indicates historical costs of fully installed 6.6kW solar systems across Australia over the same period.

The average price of $6,462 in February is a big increase on last February’s $5,378 – up around 19%. While the jump may be a disincentive for some, the bigger picture is putting off a solar installation for whatever reason is simply locking in electricity bills much higher than they would otherwise be.
Even at current higher prices, payback on PV remains quite rapid – typically ranging from 4 years, 6 months in Adelaide to 6 years, 6 months in Melbourne for a 6.6kW system, with other state capitals falling in between. Given recent/current world and local events, it’s not just electricity bills Australian households need to be concerned about and installing solar can buffer against other rising household costs.
Try SQ’s solar calculator to find how much you could be saving by putting solar panels on your home’s rooftop.
Original Source: https://www.solarquotes.com.au/blog/solar-prices-march22-mb2408/


