
Can A Home Battery On A Time-Of-Use Tariff Pay For Itself Yet?


If you have a home battery, a time-of-use tariff can save you money.
How much depends on…
- Battery Capability: This includes usable storage capacity, power output, and flexibility.
- Location: Time-of-use tariffs vary greatly from state to state. To a lesser degree, they can vary within states.
- Electricity consumption habits and solar electricity production
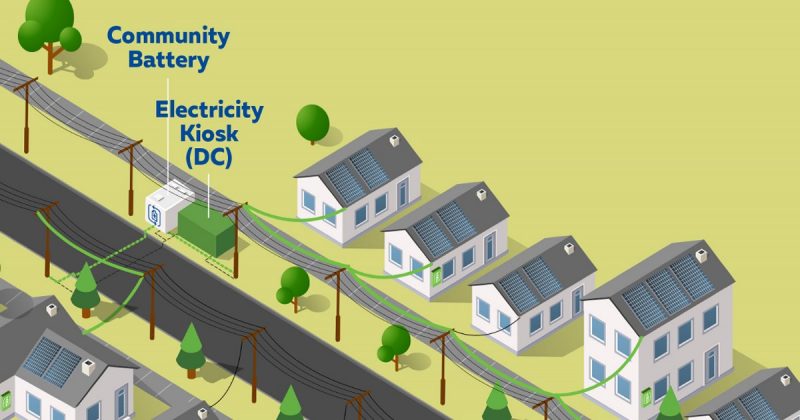
- Whether or not you are part of a VPP (Virtual Power Plant) that allows a time-of-use tariff.
Because a battery can provide power during peak periods when grid electricity is expensive, it provides an advantage over a flat tariff. To show what a Brobdingnagian1 difference time-of-use tariffs can make, I’ll show the advantage it has over a flat tariff for a Sydney household with a high evening electricity consumption that makes it an excellent candidate for getting significant savings from a home battery.
Quick Tariff Overview
The three main tariffs available to households are:
- Flat tariff: The same charge per kilowatt-hour of grid electricity no matter when it’s used.
- Time-of-use tariff: The amount charged per kilowatt-hour depends on when it’s consumed. These can be seasonal or based on the time of day. Unless you have a reeeeaaallllllyyy big battery, seasonal ones aren’t helpful for battery households. Requires a smart meter.
- Demand tariff: Low per kilowatt-hour charge, but there is an additional demand charge passed on maximum power use during a peak period each month. Requires a smart meter.
While it may be possible for a solar battery household to be better off with a demand tariff than a time-of-use one, that currently looks unlikely. The ones I’ve looked at have been surprisingly bad for most battery households and can be even worse than a flat tariff.
Most Australians can also get a plan that exposes them to wholesale electricity prices. These can provide considerable savings, but to make the most of them requires a smart battery system able to decide on its own when is a good time to buy or sell electricity2.
In this article, I’ll only compare a flat tariff with a time-of-use tariff. This is because I want to keep things simple and not confuse anyone. Especially myself.
Best Locations
The two best locations for getting electricity bill savings through the combination of a time-of-use tariff and a home battery are:
- New South Wales, and…
- Western Australia
In both places, peak electricity prices on time-of-use tariffs are high, which maximizes savings from using a battery at these times.
In Western Australia, there are unfairly low solar feed-in tariffs that improve the economics of home batteries. But because only homes with solar systems of 6.66 kilowatts or smaller can get a feed-in tariff, very few people have a solar power system larger than this, making it difficult to regularly fully charge a battery with solar energy.
I’m going to consider a Sydney home with a 10 kilowatt solar system. This size system is large enough to usually fully charge a home battery throughout the day. But in this particular instance, it doesn’t matter because the low cost of off-peak electricity means it’s not a problem to charge the battery from the grid.
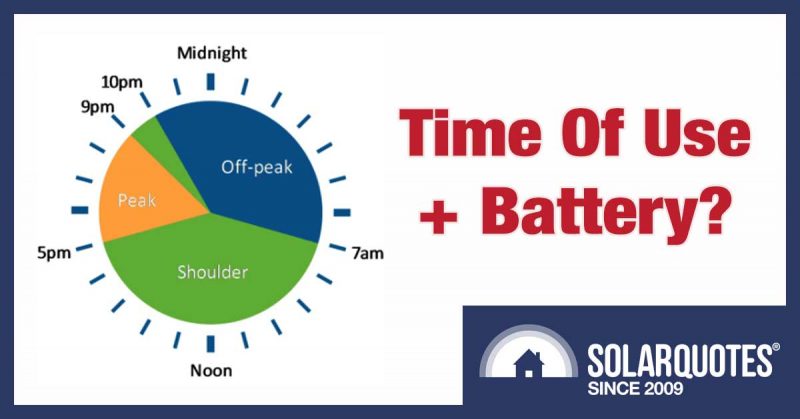
Sydney Time-Of-Use Tariff
Time-of-use tariffs are considerably more complex than flat ones. There are up to three different rates:
- Peak: Most expensive
- Off-peak: Least expensive
- Shoulder: An in-between rate.
The times these different rates apply can vary between retailers, time of year, and time of week. Unfortunately, finding the exact times is difficult as the government’s Energy Made Easy site doesn’t even bother to show them, despite the large amount of money that went into making it. You may find the times by poking around on electricity retailer sites, but they often do a good job of hiding them, so don’t be surprised if you have to poke hard.
For my example, I’ll use AGL Solar Saver time-of-use tariff for three main reasons:
- Unlike some, it charges a peak rate on every weekday of the year.
- It has a high solar feed-in tariff of 17 cents for solar systems of 10 kilowatts or less, so it’s a good choice for solar households.
- I could find information on it.
Its time periods and charges per kilowatt-hour on weekdays are:
- Off-peak 10pm-7am: 13.72 cents
- Shoulder 7am-2pm: 21.78 cents
- Peak 2pm-8pm: 53 cents
- Shoulder 8pm-10pm: 21.78 cents
On weekends there is no peak period. Instead, the Shoulder rate is charged from 7 am-10 pm.
Sydney Flat Tariff
I will compare the time-of-use tariff to the flat tariff version of the same plan. This charges 26.36 cents per kilowatt-hour and has an identical 17 cent solar feed-in tariff.
A Good Day For Home Batteries
For my example, I will use a household with electricity consumption patterns that are well suited for maximizing the return from a solar battery. Here’s an example of weekday electricity consumption and production graph from the home’s Solar Analytics consumption monitoring system before a battery is added:
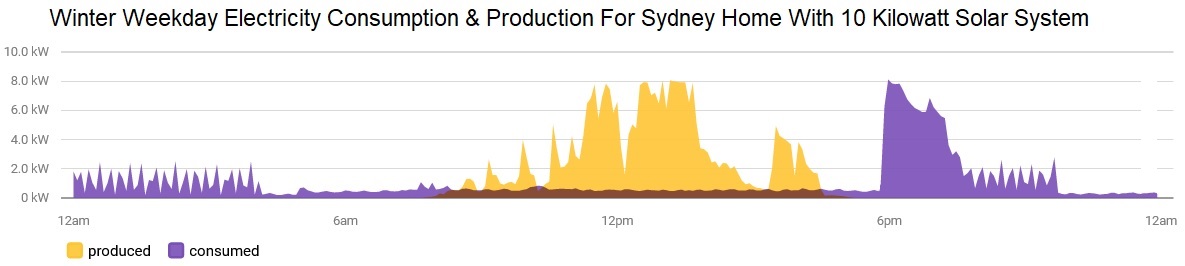
On this particular winter day, everyone left the house early and used very little electricity between getting up and heading out. (The house must be infested by those weird people who don’t eat breakfast.) Although there were lots of clouds that day, especially in the morning, the solar system still produced more energy in total than the household consumed. When people returned home in the evening, they turned on the air conditioning to warm the place up, turned on the oven, and who knows what else. This caused electricity consumption to soar during the peak period.
By downloading the smart meter readings I was able to make a graph of the grid electricity consumption for each half-hour::
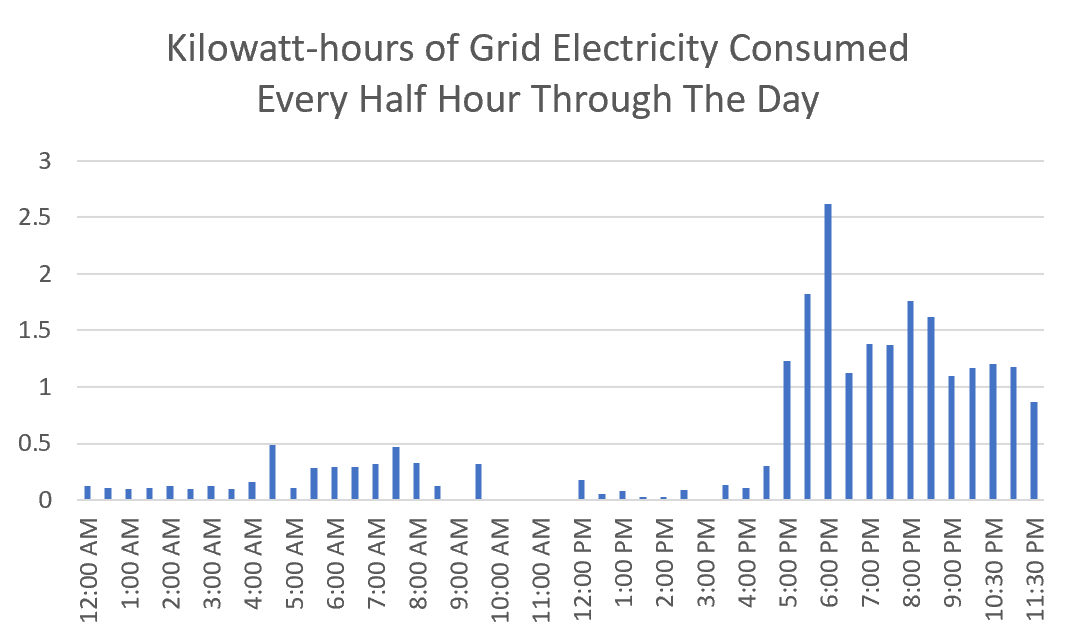
As you can see, thanks to low consumption early in the morning and solar energy production throughout the day, they used very little grid electricity until evening.
To work out how much they’d have to pay with a time-of-use tariff, we’ll need to break down their consumption into Peak, Shoulder, and Off-peak periods:
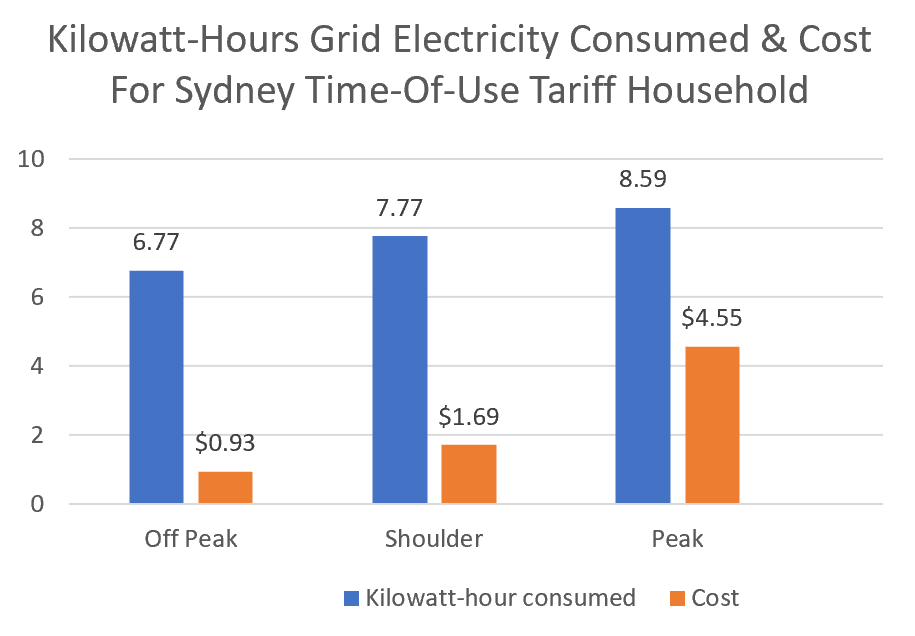
While the heaviest electricity consumption occurred in the evening, peak electricity consumption was only 37% of total grid electricity use. However, it was 63% of the total cost, which came to $7.17 for the day.
If we compare the cost of grid electricity for the time-of-use tariff and the flat tariff, then — ignoring supply charges — we get this:
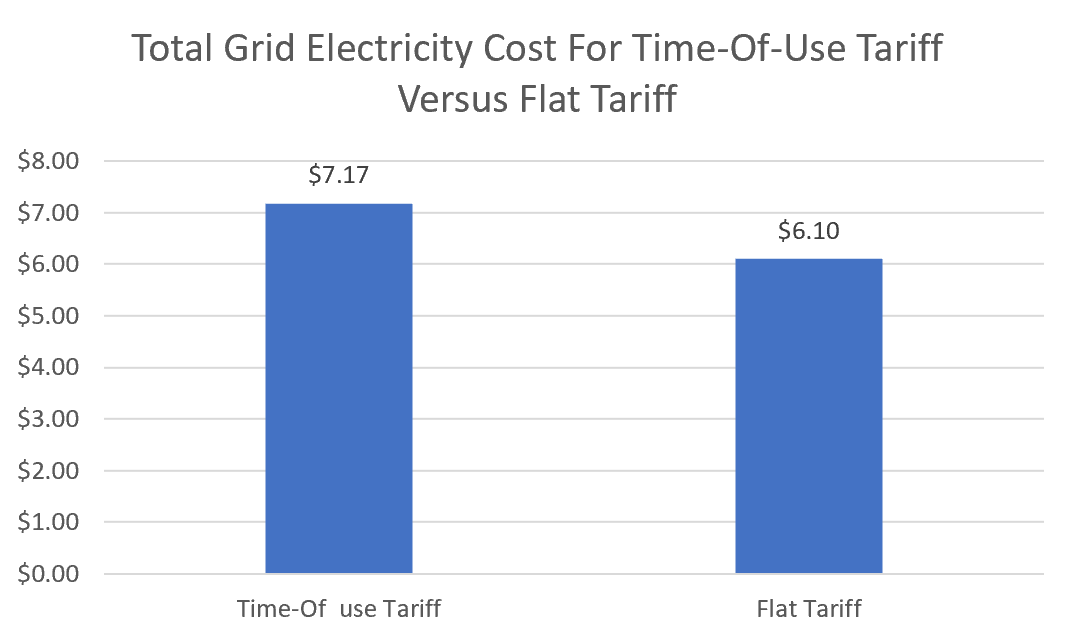
The time of use tariff costs $1.07 more than the flat tariff. Because electricity consumption was high during the peak period, it’s no surprise the time-of-use tariff was more expensive.
Installing a home battery will change this.
Note: if the electricity bill was lower with a flat tariff than a time-of-use tariff before you installed the battery, then you should compare the savings from having a battery to what the household would pay without one on a flat tariff and not to what they would pay without a battery on a time-of-use tariff. I’m sure you won’t make this common mistake now you’ve read about it in a paragraph buried in the middle of a long article that utterly fails to reinforce your memory by referring back to it again.
Average Consumption Assumption
While I took the electricity consumption given above from just one day, I’m going to assume the household electricity consumption during the evening peak and shoulder periods on that day is the average for those times through the year. This means the home consumes more than twice as much electricity in the evening as the Sydney average.
Adding A Solar Battery
To work out what adding a solar battery does, I’ll have to decide how big it will be. I’ve decided on one with…
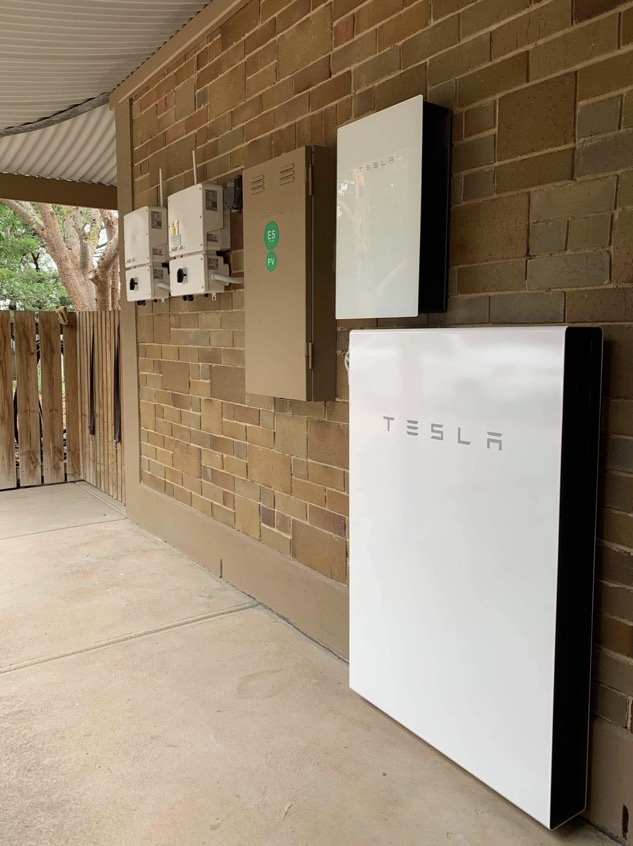
- 13 kilowatt-hours usable energy storage
This is very similar to a Tesla Powerwall 2. According to its warranty, when new, it has a usable capacity of 13.2 kilowatt-hours.
For now, I’ll assume it’s a magical battery that is 100% efficient and can supply exactly as much power as is required.
Home Battery + Flat Tariff
Assuming the battery was fully charged with solar energy, it would enable the home to avoid paying for 13 kilowatt-hours of electricity in the evening. But, because energy going into the battery for use at night can’t be exported to the grid, the home would also lose 13 kilowatt-hours worth of solar feed-in tariff. This lets us calculate the savings from having a home battery with a flat tariff as follows:
- Savings from reduced grid electricity consumption = 26.36 cents multiplied by 13 = $3.43
- Loss of feed-in tariff = 17 cents multiplied by 13 = $2.21
- Total savings on flat tariff = $3.43 minus $2.21 = $1.22
With a flat tariff, the battery saves $1.22. If this is the average daily amount saved, it would come to $445 a year or $4,450 over 10 years, which is the maximum length of most home battery warranties.
Because an installed battery with 13 kilowatt-hours of usable storage is likely to cost over $15,000 installed, it’s clearly difficult to make one pay with a flat tariff, even if the battery is magical and — completely unrealistically — fully charged with solar energy each day and fully discharged each night.
Battery + Time-Of-Use Tariff
Determining savings with a time-of-use tariff is more complex. The household used 8.59 kilowatt-hours during the peak period, so the solar battery will be able to cover all that as well as 4.41 kilowatt-hours of consumption during the shoulder period:
- Savings from reduced Peak consumption = 53 cents multiplied by 8.59 = $4.55
- Savings from reduced Shoulder consumption = 21.78 cents multiplied by 4.41 = $0.96
- Loss of feed-in tariff = 17 cents multiplied by 13 = $2.21
- Total savings on time-of-use tariff = $4.44 + $0.96 – $2.21 = $3.30
The total savings of $3.30 are more than two and a half times as much as on the flat tariff. If this were the average saved each day, it would come to $1,205 over a year. But this is impossible because the peak tariff is only available on weekdays. On weekends the battery would only save $2.83 per day. Over a week, the average savings per day would come to $3.16, and over a year, they’d total $1,155. That’s still much better than the flat tariff, but it’s possible to do even better by charging the magic home battery with off-peak electricity.
Off-Peak Battery Charging Improves Savings
Because the solar feed-in tariff is 17 cents and off-peak electricity is only 13.72 cents, rather than charging the battery with solar energy, it makes more sense to export all the solar energy produced and charge the home battery with off-peak electricity. This would increase the average daily savings from $3.16 to $3.59. Over a year, that would come to $1,310, and over a decade it would be $13,100.
Normally the off-peak rate is higher than the solar feed-in tariff, so this situation is unusual. If the solar feed-in tariff were to fall by 2.3 cents and/or the off-peak rate increase by that much it would no longer be cheaper to charge the battery with off-peak electricity.
No Such Thing As A Magic Battery
So far I’ve assumed the solar battery is magical with 100% efficiency and can always supply exactly as much power as needed. However, in real life, batteries have several drawbacks that include:
- Efficiency losses
- Inability to perfectly match power output to power consumption.
- Inflexibility
- Battery capacity deterioration.
- Unable to always be fully charged with solar energy.
Efficiency Losses: In real life, a Tesla Powerwall 2 has a round trip efficiency of around 88%. This means 1.14 kilowatt-hours of electricity have to go in to get 1 kilowatt-hour out.
Inadequate Power Output: Batteries also have difficulty eliminating grid electricity use when supplying power. It is common for batteries not to start supplying electricity until around 100 watts or more is being drawn from the grid. Over a 6 hour peak period, this could easily come to 0.6 kilowatt-hours of peak electricity coming from the grid rather than the battery.
Home batteries are also limited in how much power they can supply. Some, like the Powerwall 2, can supply 5 kilowatts of continuous power while a considerable number supply less. If the household’s power draw exceeds what the battery can supply, the excess will come from the grid.
Inflexibility: It’s possible for a solar battery system to be plain dumb and run flat, providing power to the home before the peak period starts.
Battery Capacity Deterioration: The capacity of most batteries deteriorates with time and use. For lithium batteries, this may be a few percentage points per year.
Inadequate Solar Energy: Because of clouds and/or high electricity consumption during the day, it’s often impossible to fully charge a home battery with solar energy throughout the day. While not a problem with a time-of-use tariff in this example, this is an important consideration for most battery installations.
Real Life Battery & Time-Of-Use Tariff
If we assume our battery with 13 kilowatt-hours of usable storage has the following real-life drawbacks…
- An 88% round trip efficiency
- An average of 0.7 kilowatt-hours are drawn from the grid during peak periods
…then when used with a time-of-use tariff, the average daily savings drop from $3.16 to $2.57. Over a year, this comes to $938.
If we also assume the battery capacity declines at a constant rate to 80% of its original 13 kilowatt-hour capacity over 10 years, then the total savings over a decade would come to $8,440.
Real Life Battery & Flat Tariff
Installing a home battery with an 88% round trip efficiency on a flat tariff, savings would fall from $1.22 a day to 92 cents a day. This would come to $336 over a year.
If the battery capacity declines at a steady rate to 80% after 10 years, then the savings over a decade would come to $3,020.
But, because there isn’t an option to charge the battery with off-peak electricity on a flat tariff, we should allow for periods when the battery cannot be fully charged with solar energy. If we assume it’s used at an average of 80% of its full capacity, then the average savings per day would be 74 cents per day or $269 per year. Including battery deterioration, total savings would come to $2,686 over 10 years.
Time-Of-Use Tariff Is The Clear Winner
I’ve shown the savings over one year of for the flat and time-of-use tariffs on the following graph:
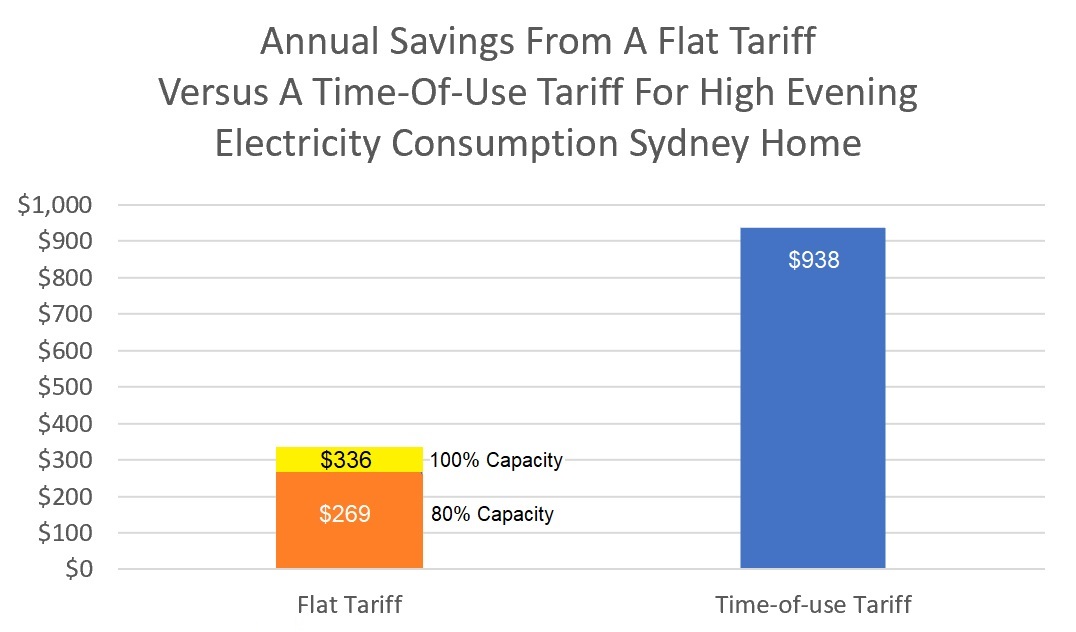
I included the savings with a flat tariff if the battery is used at 100% capacity because I felt sorry for it, but it’s not a situation likely to occur in reality. Not unless a home has a 30 kilowatt solar power system and low daytime electricity consumption.
Using the more realistic 80% capacity factor gives savings of $269 over a year. The savings from the time-of-use tariff are three and a half times higher and come out around $670 ahead. This makes it clearly superior for anyone with a solar battery that can offset at least some of their peak electricity consumption.
The home in my example consumes more than twice as much electricity in the evening as is the average in Sydney, so this is not a result most households will have. However, there are plenty of homes in Sydney that use this much or more. If you live in one of them, you may be getting close to solar batteries paying for themselves solely through savings on electricity bills. If you place a high value on having clean, quiet, backup power, then — for you — they may already be worthwhile.
But when deciding whether or not to get a home battery, leave some leeway for both electricity prices and solar feed-in tariffs to change. As both smart meters and solar battery storage become more common, the difference between peak and off-peak electricity rates should decrease. But we’ll have to wait and see what actually happens.
Footnotes
Original Source: https://www.solarquotes.com.au/blog/battery-time-of-use/
Related Posts:
 Will A Demand Tariff Improve Home Battery Payback?
- Don’t Panic: SA Homes Can Remain On Flat Tariff When…
- Solar Owners: Shop Around For The Best Electricity Plan
- Buying A Battery Without Solar Is No Longer A Crazy Idea
- New Minimum VIC Solar Feed-In Tariffs Locked In
- AER Ruling: Victorian DNSPs Must Offer Flat Tariff…
- Don’t Install A Smaller Solar System To Get A Higher…
- Synergy’s Midday Saver Tariff: Home Batteries Can Pay in WA


