

How Time Of Use Tariffs Can Boost Your Solar Battery Savings

I’ve been given a mission. It’s to determine how much money a home can save using a battery with a time-of-use tariff in every Australian capital.
This isn’t easy to do.
It’s not merely a matter of gathering information and crunching numbers. The hard part is presenting the results in a way that doesn’t make battery optimists cry.

“Who did this to you? Who hurt you so badly you feel the need to tell horrible lies about beautiful batteries?”
It’s very easy to tell people the maximum possible savings from a solar battery. The hard part is breaking the news to them they’ll never see that much benefit in real life. It can be tough for those who have fallen in love with the fantasy of an ideal battery. They don’t want to listen when you try to tell them that reality will sink its claws into their perfect numbers and drag them down to a far lower level.
But I feel obligated to let them know what they’re getting into. I used to be regularly whacked on the knuckles by a nun for fibbing, so I’m very honesty orientated. But I still feel terrible for tearing down people’s dreams.

Why she felt the need to whack my knuckles every time she told a fib, I’ll never know.
Fortunately, I have a solution. It’s called giving up.
I will give the maximum possible savings a home battery can provide in each capital and if optimists want to use those figures, I won’t get in their way. But, in the interests of realism and keeping my nun phobia at bay, I’ll also include information on why you’re unlikely to see those savings in real life.
I’ll begin by briefly covering the different tariffs and then determine the maximum possible savings. I’ll start with flat tariffs and then show the greater benefits from time-of-use tariffs.
Electricity Tariff Terminology
Here — in a nutshell — are the four main ways people pay for electricity:
- Flat tariff: Same charge for every kilowatt-hour of grid electricity.
- Time-of-use tariff: Charge per kilowatt-hour depends on time used. Can be based on seasons or time of day, but only time of day ones make sense for home batteries1.
- Demand Tariff: Low per kilowatt-hour charge but has a demand charge each month based on the maximum amount of power used during peak periods.
- Wholesale Price Exposure: This is an electricity plan where — in addition to other charges — the household pays the wholesale price for grid electricity when it’s used.
I’m only going to consider flat and time-of-use tariffs. The demand tariffs I’ve looked at so far are worse for solar battery households than time-of-use ones and can even be worse than a flat tariff.
Electricity plans that expose households to wholesale electricity prices have a lot of potential to lower bills, but to maximize the benefit requires a solar battery system smart enough to buy and sell on its own initiative and they’re not currently available.

During the war, Mr Peanut was shelled mercilessly.
Battery Assumptions
To work out the maximum possible savings from a home battery, I’ll have to decide its characteristics. I’ll make the following simple assumptions for my example battery:
- 10 kilowatt-hours of usable battery storage.
- Round trip efficiency of 90%.
- It’s fully charged with solar electricity every day.
- The household’s electricity consumption is high enough to be fully discharged during a Peak period, if there is one, every night.
For any remotely normal home, the last two assumptions are about as realistic as a cheese submarine, but for now, I’ll ignore that.
Flat Tariffs By Capital City
To work out the maximum possible battery savings I’ll need to know the cost of grid electricity and the solar feed-in tariff. To get these figures for flat tariffs2 I can use the SolarQuotes electricity plan comparison tool and choose what looks like the best plan from a large retailer for a home with a solar system of 10 kilowatts or less. Rounded to the nearest cent, the per kilowatt-hour amounts are:
- Adelaide: 34 cents, Feed-in 16 cents
- Brisbane: 22 cents, Feed-in 15 cents
- Canberra: 20 cents, Feed-in 10 cents
- Darwin: 27 cents, Feed-in 9 cents3
- Hobart: 25 cents, Feed-in 10 cents
- Melbourne: 18 cents, Feed-in 10 cents
- Perth: 29 cents, Feed-in 4 cents
- Sydney: 26 cents, Feed-in 17 cents

If you even slightly resemble this picture, you may be a battery optimist.
Determining Flat Tariff Savings
Using the above information for each capital it’s easy to determine the maximum possible savings using my example solar battery. All I have to do is:
- Determine how much the household saves in grid electricity by discharging the battery each night.
- Determine how much charging the battery with solar energy effectively costs the household every day.
- Subtract the cost from the savings to get the final result.
Starting with Adelaide and following the three steps, I get:
- Using 10 kilowatt-hours of battery energy at night instead of grid electricity will save $3.40
- With 90% efficiency you will need 11.1 kilowatt-hours to charge the battery, which costs $1.78 in forgone solar feed-in tariff.
- Subtracting the cost from the savings gives $1.62
Over a year this comes to $590.
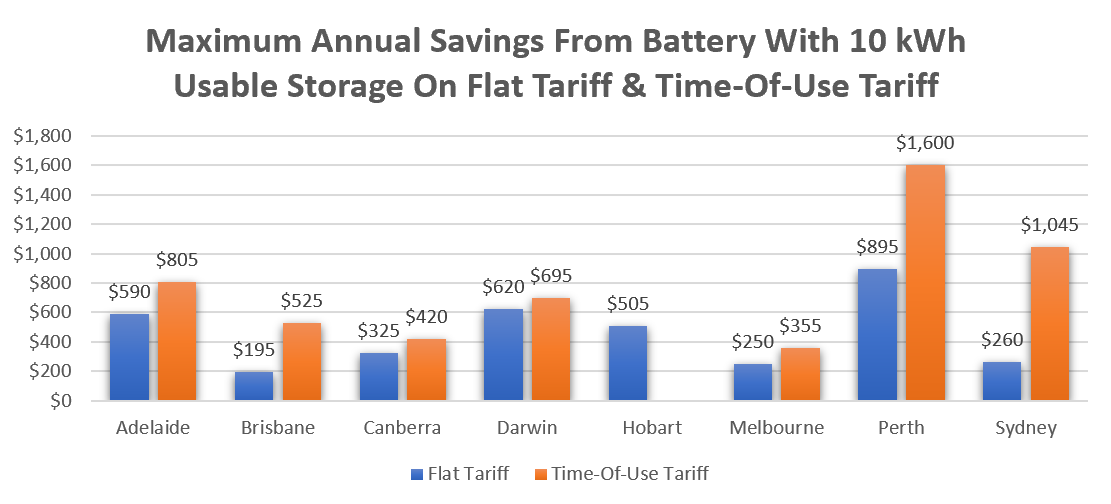
Performing the same calculation for all capital cities gives:
- Adelaide: $590
- Brisbane: $195
- Canberra: $325
- Darwin: $620
- Hobart: $505
- Melbourne: $250
- Perth: $895
- Sydney: $260
As you can see, Perth comes out well ahead, thanks to their low feed-in tariff. Conversely, the least profitable place for a home battery on a flat tariff turns out to be Brisbane thanks to a low electricity price and high feed-in tariff.
Time-Of-Use Tariffs By Capital City
Determining the best time-of-use tariffs in each capital is more difficult, as the SolarQuotes retailer comparison page can’t handle them yet. For WA it was easy, since there’s only one available for Perth homes. For everywhere else I looked for the best available for a solar household. There may be better time-of-use plans than those I found, but the ones I used should be among the best.
Here’s the cost of a kilowatt-hour of electricity in cents for the different periods, plus the solar feed-in tariff:
- Adelaide: Peak 41c, Shoulder 25c, Off-peak 20c, Feed-in 13c
- Brisbane: Peak 30c, Shoulder 22c, Off-peak 18c, Feed-in 12c
- Canberra: Peak 26c, Off-peak 22c, Feed-in 12c
- Darwin: Peak 31c, Off-peak 24c, Feed-in 9c
- Melbourne: Peak 25c, Off-peak 18c, Feed-in 12c
- Perth: Peak 56c, Shoulder 29c, Off-peak 15c, Feed-in 4c
- Sydney: Peak 53c, Shoulder 22c, Off-peak 14c, Feed-in 17c
A majority of the time-of-use plans have three different rates — Peak, Shoulder, and Off-peak — while a few only have Peak and Off-peak with no in-between Shoulder rate.
Hobart is missing from the list because I couldn’t find a daily time-of-use tariff in Tasmania. The only ones I saw were seasonal and it requires a huge home battery to take advantage of them.

You’ll need to grab one of these if you want a home battery big enough to make use of a seasonal time-of-use tariff. Just take care to avoid any on fire, even if they come with a substantial discount.
Best Possible Time-Of-Use Savings
Determining the maximum possible savings from a time-of-use tariff is a little more difficult than with flat tariffs. This is because the Peak rate isn’t paid on weekends4. When there is a Peak period I’ll assume the solar battery will be completely discharged within it. On days without a peak period, I’ll assume the battery is fully discharged during the next most expensive period. This will be either a Shoulder or Off-peak rate depending on the plan.
Calculating the maximum possible savings using my example battery gives:
- Adelaide: $805
- Brisbane: $525
- Canberra: $420
- Darwin: $695
- Melbourne: $355
- Perth: $1,600
- Sydney: $1,045
As you can see, Perth is way out ahead with a maximum battery saving of $1,600. This is due to having the highest peak and shoulder rates in the country and the lowest feed-in tariff.
Sydney is in second place with $1,045. But savings there were calculated slightly differently from other capitals. Because the Off-peak rate was lower than the solar feed-in tariff, I assumed the battery was fully charged with Off-peak grid electricity each day. If it’s instead charged with solar electricity, the annual savings will be $120 less and come to $925.
In last place is Melbourne thanks to its low Peak rate. Canberra is second-worst and Hobart is next, but this is with the maximum savings possible of $507 with a flat tariff, as no daily time-of-use tariffs aren’t available there.
Optimists Can Stop Reading Now
If all you want to know is the maximum possible savings from a home battery you can stop reading now. I will mention a few reasons why a home battery may not actually save that much money in real life, but if you’re not interested in reading things that aren’t 100% optimistic, there’s no reason to continue.
You can instead admire the battery posters on your walls, hug your pillow with the LG Chem RESU cover, and perhaps practice kissing using your framed photograph of a Tesla Powerwall 2 signed by Elon Musk.

Of course, even battery optimists can disagree on what they should be optimistic about.
5 Reasons Why You Won’t Get Maximum Savings Out Of A Battery
Are the home battery optimists gone? If so, I’ll provide some information they may not want to know. Here are five reasons why the maximum possible savings aren’t something you’ll get out of a battery in real life:
- There won’t always be enough surplus solar energy to fully charge a battery during the day.
- Normal households often won’t use all the stored energy during peak periods.
- Home batteries, with one exception, deteriorate in capacity with use.
- To determine savings you should compare how much you would pay on the best possible electricity plan without a solar battery and the best possible electricity plan with a battery. Just looking at what you would pay if you were on the best battery plan without a battery is misleading. This applies to the maximum possible savings I give in this article.
- In real life, solar batteries are unlikely to work as perfectly as they do in hypothetical examples. As a result, you have to expect some additional losses, inefficiencies, and downtime.
Just how much these problems will eat into savings is impossible to say, as they will vary between locations and from case to case. But it will come to a lot. Below I’ll give examples of two problems — fully charging with solar panels and fully discharging during Peak periods.
Full Battery Charging In Winter Is Difficult
Even if a home has a 10 kilowatt solar system, it often won’t be possible to fully charge a 10 kilowatt-hour battery in the middle of winter.
The graph below is the Solar Analytics information for an Adelaide home with 10.56 kilowatts of solar and an annual electricity consumption of around 6,000 kilowatt-hours, average for a four-person SA household.
If I assume the home self-consumes an average of 4 kilowatt-hours of solar energy during the day — which is a low amount — and then put a red arrow over every day in July the home doesn’t generate enough surplus solar energy to fully charge a home battery with 10 kilowatt-hours of usable storage, I get the following:
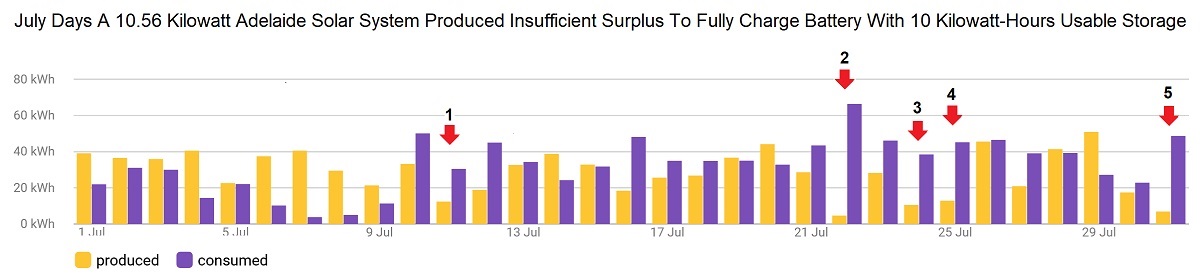
If this graph looks tiny to you because you’re on your phone, trust me, those red spots are bad.
In July, it shows that on 5 out of 31 days — about 16% of the days — the solar system did not generate enough surplus energy to fully charge a battery with 10 kilowatt-hours of usable storage and 90% round trip efficiency. So even with 10.56 kilowatts of rooftop solar, this household won’t always be able to fully charge a battery that size with solar energy.
If the household instead had 6.6 kilowatts of rooftop solar the situation would be much worse, with a shortfall on 11 out of 31 days.
The problem is worst in winter but can occur any time of the year solar energy generation is low and/or daytime electricity consumption is high. You can charge batteries with off-peak electricity instead of solar power, but in most cases this is more expensive. Of the electricity plans I used, only Sydney had a solar feed-in tariff is higher than the Off-peak electricity rate.
Low Electricity Consumption In Peak Periods
Most households usually use considerably less than 10 kilowatt-hours during peak periods. The typical amount varies between households and electricity plans, but is often under 7 kilowatt-hours. This reduces the maximum savings possible from a battery with 10 kilowatt-hours of usable storage because discharging outside of a peak period or not discharging at all reduces potential savings.
While low peak period consumption will sometimes reduce the problem of being unable to fully charge the battery with solar power, the two problems often occur at different times of year. Low household electricity consumption is most common in spring and autumn when little heating or cooling is required, while solar generation is worst in winter5.
The graph below shows the electricity consumption in April of an Adelaide household with annual electricity consumption of around 6,000 kilowatt-hours.
If we assume half the household’s electricity consumption occurs during the peak period on days there is one, then the home will only use all the energy in a battery with 10 kilowatt-hours of usable storage on days when electricity consumption is 20 kilowatt-hours or more. I have marked all the days in April this occurs with a red arrow:
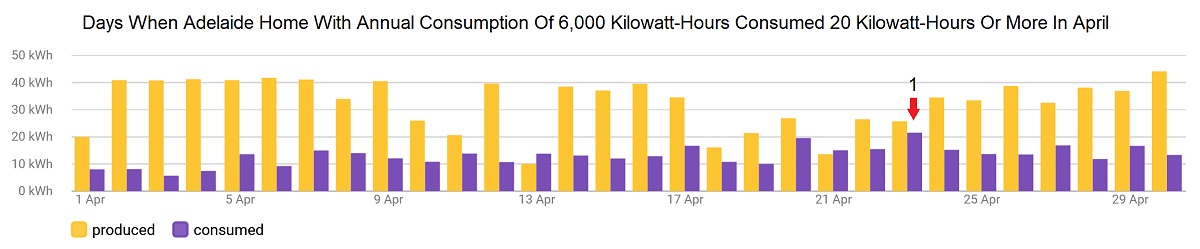
If it’s hard to see this graph because you’re on your phone, this time the red dot is good.
While the 10.56 kilowatt solar system usually produces plenty of surplus energy in April, there is only a single day when peak period energy consumption will be high enough to make full use of 10 kilowatt-hours of usable storage.
Smaller Solar Batteries May Not Help
The smaller a home battery is, the easier it will be to fully charge with solar and fully discharge during peak periods. But this isn’t necessarily a cost-effective solution because smaller battery systems normally cost more per kilowatt-hour of usable storage. Also, a larger battery used at lower capacity will tend to deteriorate less rapidly. This makes it difficult to improve the economics of batteries by using one with a lower capacity.
VPPs Can Provide An Advantage
Some good news about batteries is Virtual Power Plants — VPPs for short — can improve their payback. But they also come with drawbacks, as every VPP involves sacrificing at least some control over the battery. Ideally, a VPP can provide substantial additional income.
Less ideally, they can potentially cause more wear and tear on your battery than the benefits are worth. While VPPs have plenty of potential, they also carry risk.
You can check what’s available in your area with our VPP Comparison Table.

Wait a minute… Why does this battery optimist have a gun on his wall?
A Simplistic Risk Assessment
I could do a lot of research and write around 40,000 words delving into details of determining exactly how much batteries will or won’t save you, but that sounds like hard work. Instead, I’m going to present one simple table that puts all the onus on you.
The table shows savings possible under four different conditions:
Maximum: This is the maximum possible savings the example battery that has 10 kilowatt-hours of usable storage and a 90% round trip efficiency can give. If you are foolishly optimistic or believe the benefits of a VPP will make up for any losses, feel free to use the savings in this column.
Optimistic — 80% Max: This is for people who like to look on the sunny side of things but aren’t so optimistic they don’t bother to buckle their seat belts. The savings here are simply 80% of the maximum.
Mediocre — 60% Max: For a middle-of-the-road approach, this gives savings 60% of the maximum.
Pessimistic — 40% Max: If you’re the sort of person who likes to err on the side of caution, you can use the results here, which are 40% of the maximum possible savings.
The results are annual savings. If you want a quick and dirty estimate of savings over 10 years — the maximum warranty length of most home batteries — add a zero to the end:

Perth Comes Out On Top
Perth is clearly the capital with the best return from a home battery. If you expect the return to be a mediocre 60% of the maximum, provided these two conditions are met…
- The battery lasts a few years beyond the end of its warranty
- You place at least some value on its ability to provide backup power
…Perth appears to be at least close to the point where batteries begin to pay for themselves.
But it’s not a sure thing. Firstly, circumstances will have to be considered on an individual basis. Don’t just pick a number off a table because it looks good. We also don’t know what will happen with electricity prices over the next 10 years. Personally, I expect them to head downwards as more batteries are installed along with more solar and wind capacity. But, despite this, things are looking good for Perth to lead the nation in home battery installations.
On the downside, home batteries face challenges in WA not seen in the rest of the country:
- Homes with rooftop solar over 6.66 kilowatts can’t receive a solar feed-in tariff, so almost all systems are under this size. While Perth has the highest solar output of any Australian capital, there are still likely to be many days when it’s not possible to fully charge a battery with solar energy.
- I only know of one VPP operating in WA and zero I can recommend. This means they are not an option for improving battery payback at this time.
- Solar households have been underpaid for the electricity they provide to the grid and the difference used to subsidise other generation in WA. The state may attempt something similar with home batteries, which will reduce their benefit to households.
Note I used the current feed-in tariff for new solar installations in WA of around 4 cents per kilowatt-hour. If you’re receiving the old feed-in tariff of 7.1 cents, the return from a battery will be around 8% less than the figures in the table above. With a 7.1 cent feed-in tariff, the annual savings for the different conditions will be:
- Maximum: $1,475
- Optimistic (80% Max): $1,180
- Mediocre (60% Max): $885
- Pessimistic (40% Max): $590
Although there are drawbacks, I am optimistic about batteries in WA. Because I think solar battery prices will fall, a home battery boom looks set to occur in the western third of the country.
A Rough Guide Only
The table of potential savings for a home battery with 10 kilowatt-hours of usable storage is not meant to be any kind of accurate guide to how much you’re likely to save from a battery. But it does make one thing clear. There’s a wide range of savings people can claim a solar battery provides without actually fibbing. A battery with 10 kilowatt-hours of usable storage could technically provide the maximum savings and potentially more with a good VPP. But it’s no fib when I say you should be prepared for a far less than optimal outcome.
Footnotes
- No battery is suitable for storing energy between seasons. The solution in Australia is to install more solar and wind capacity — as well as use existing hydro capacity — to ensure there is enough generation year round and use battery storage to fill in short term gaps. ↩
- Note flat tariffs may become unavailable to homes with smart meters in some parts, such as South Australia and Queensland. I disapprove of this, because making electricity bills more confusing is the sort of thing that gives grannies heart attacks. ↩
- You may be able to get a better feed-in tariff from Rimfire in the NT, so I’d check what they offer. ↩
- Some plans may also not have a peak rate on public holidays. ↩
- Except in the far north, because they’re weird. ↩
Original Source: https://www.solarquotes.com.au/blog/tou-solar-batteries-savings/
Related Posts:
 Will A Demand Tariff Improve Home Battery Payback?
- SimpliPhi completes UL 9540A fire safety tests
- Home Batteries Finally Taking Off?
- Federal Energy Rebates: Solar Households May Come Out Ahead
- A Battery Without Solar Can Be Worth It in WA, But Only Just
- Phase III construction begins on expansion of…
- Beating Blackouts: 4 Levels Of Home Battery Backup
- Don’t Panic: SA Homes Can Remain On Flat Tariff When…


