

Australian Solar Prices: September 2021 Update

How much are Australians paying for solar power systems – and how does that compare to around the same time last year?
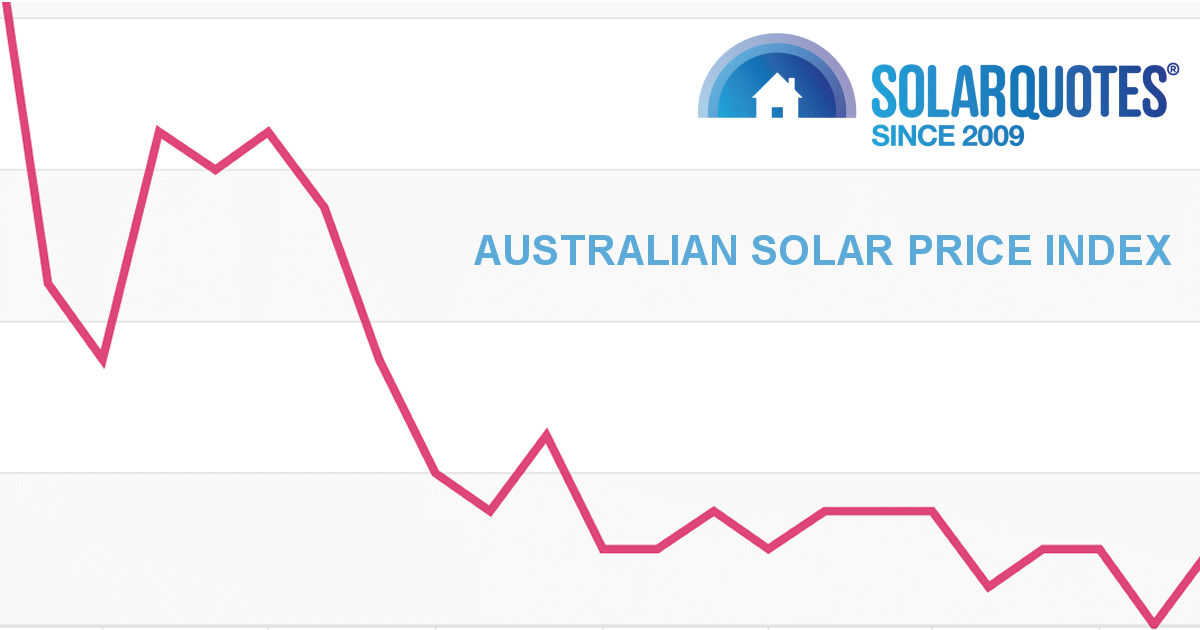
A few months back, SolarQuotes Founder Finn launched the Australian Solar Price Index – it’s an interesting interactive tool displaying the average prices paid for rooftop solar power system installations in each state and nationally over time. You can also drill down to see data on specific system sizes and even particular brands of solar panels and inverters.
When system owners submit a solar installer review here on SQ, we ask them to indicate the price they paid for their system and other details, and the Index is generated using that information.
The table below, based on the Index, indicates how much Australians paid per watt on average for fully-installed rooftop solar systems purchased in August 2021, compared to systems purchased in August 2020. The figures noted in the table are after all federal and state rebates/subsidies, all system sizes and for systems of all levels of quality. SolarQuotes accepts reviews of thousands of solar companies, not just those within SQ’s trusted installer network.
| State | Cost per watt (August 2021) |
Cost per watt (August 2020) |
| QLD | $0.89 | $0.93 |
| NSW | $1.04 | $1.01 |
| ACT | $1.04 | $1.11 |
| VIC | $0.87 | $0.75 |
| TAS | $1.09 | $1.18 |
| SA | $0.90 | $0.96 |
| WA | $0.74 | $0.76 |
| NT | NA | NA |
| AU | $0.91 | $0.94 |
Looking back as far as the Australia Solar Price Index goes, cost of solar systems per watt (all sizes) averaged $1.09 across Australia in September 2019 – so August’s result was a drop of more than 15% at this point.
Solar Prices Holding Up Under Pressure
Comparing August 2021 to 2020 produces a pretty mixed bag of results between states, but prices are generally holding up well given the various challenges we’ve seen over the last 12 months, including the ongoing pandemic and polysilicon price pressure. How long that will remain the case is anyone’s guess. If the last 20 months or so has taught us anything, it’s to expect the unexpected.
But what happened in Victoria where prices have gone up substantially?
It’s a little odd as Victoria’s solar panel rebate was reduced from a maximum value of $1,850 to a maximum $1,400 from July 1 last year. It wouldn’t be unreasonable to expect average cost per watt to have increased in August 2020, but it didn’t – it dropped, as it also did in July 2020. While $ per watt has bounced around after August, it has never been as low since (or before).
It doesn’t appear to have been a sudden move to bigger systems causing the low $ per watt in Victoria in August last year. But much of August 2020 also saw Stage 4 lockdowns in Melbourne. So, between fewer records to base averages on, buyers perhaps flocking to cheap (crap) solar and quality installers possibly doing better deals trying to bring much-needed sales over the line due to the circumstances skewed the results.
It’s worth noting in the table above Western Australia has the cheapest solar prices even though it doesn’t have an additional scheme like Victoria. But that low pricing isn’t experienced across the state. Perth has the cheapest solar in Australia – and the world – and the level of installations in the Perth metro area brings down the average cost per watt across WA. The low cost of solar there also helps make up for WA’s rather crappy feed-in tariff; well, for Perth residents anyway.
Big Price Reductions For Really Big Systems
Something else helping to keep a lid on average $ per watt is Australians are increasingly buying larger systems. Generally speaking, the bigger the system, the lower the cost per watt. This is partly due to the way the national “solar rebate” works as it is based on panel capacity.
Looking at several specific system sizes (national average system cost), you can see 6.6kW systems were a little pricier this August compared to last (6kW a little cheaper), while the cost of really big systems dropped substantially.
| System size | System cost (August 2021) |
System cost (August 2020) |
| 6.6kW | $5,517 | $5,360 |
| 8kW | $7,494 | $8,085 |
| 10kW | $8,623 | $10,224 |
Check out the Australian Solar Price Index here – and bearing in mind the prices it shows are for all system quality types, you can see the cost of solar here for good quality systems of various capacities.
Added note: The Index is updated in real-time, so figures will change as new reviews are submitted; and costs will generally bounce around somewhat month to month in part due to the nature of collection.
Original Source: https://www.solarquotes.com.au/blog/australian-solar-prices-september21-mb2165/
Related Posts:
 Australian Solar Prices: October 2022 Update
- Australian Solar Prices: October 2021 Update
- Australian Solar Prices: September 2022 Update
- Australian Solar Prices: November 2021 Update
- Australian Solar Prices: August 2022 Update
- Australian Solar Prices: June 2022 Update
- Australian Solar Prices: January 2022 Update
- Australian Solar Prices: February 2023 Update


