

Solar Panels On A South Facing Roof Can Pay Anywhere In Australia

TLDR: Can you put solar panels facing south in Australia? Hell yeah!
In 2010, when Australian rooftop solar power really started to take off, nearly every Australian solar system faced north to maximise energy yield. But today, on an unshaded roof, panels facing any direction can pay for themselves. This includes the ‘worst’ direction: south.
In 2022, solar panels are over 80% cheaper than in 2010, and south-facing solar can be worthwhile. If your main goal is to maximise solar generation, that’s all you really need to know. You can stop reading and cover your entire roof with solar panels.
But you may prefer to weigh up the pros and cons before investing your hard-earned cash especially as there are still a few installers and salespeople who laugh at the mere thought of south-facing solar panels.
This article will give information on south-facing solar and explain why most homeowners are likely to find it a good investment. If you’re not interested in technical details and want to know how long it will take to pay for itself, skip down to the subheading, “Can South-Facing Panels Pay?”
3 Features Of South-Facing Solar
Two important physical factors affecting the output of south-facing solar are…
- Location: The further south you go, the less energy you’ll get from south-facing solar panels. Darwin is a better location for south-facing solar than Hobart.
- Tilt: The more gentle the slope of your roof, the more energy south-facing panels will generate. An unusually steep south-facing roof will decimate your energy yield.
- Low Winter Output: In most capitals, the winter output of south-facing solar panels is under half of what north-facing panels would produce.
Location
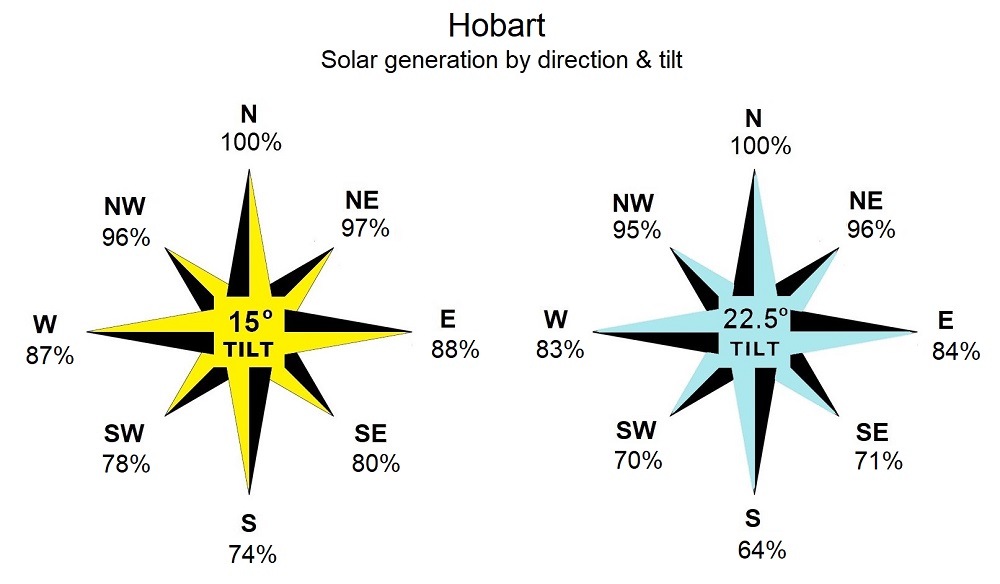
The output of south-facing panels is affected by local climate, so the decline in their relative output compared to north-facing ones doesn’t occur smoothly. But if we compare Australia’s most northerly city with the most southerly one, the difference is clear. With a tilt of 15 degrees, the annual output of south-facing panels compared to otherwise identical north-facing ones in Darwin and Hobart will be:
- Darwin: Annual output of south-facing panels is 88% of north-facing ones
- Hobart: Annual output of south-facing panels is 74% of north-facing ones
The difference is mostly because the sun is higher in the sky the closer a location is to the equator, and Darwin is 3,400 km closer.
I’ve arranged Australian capitals in order from north to south in the graph below. It shows the average annual output of south-facing solar at a 15º tilt as a percentage of the average annual output of otherwise identical north facing north at the same tilt:
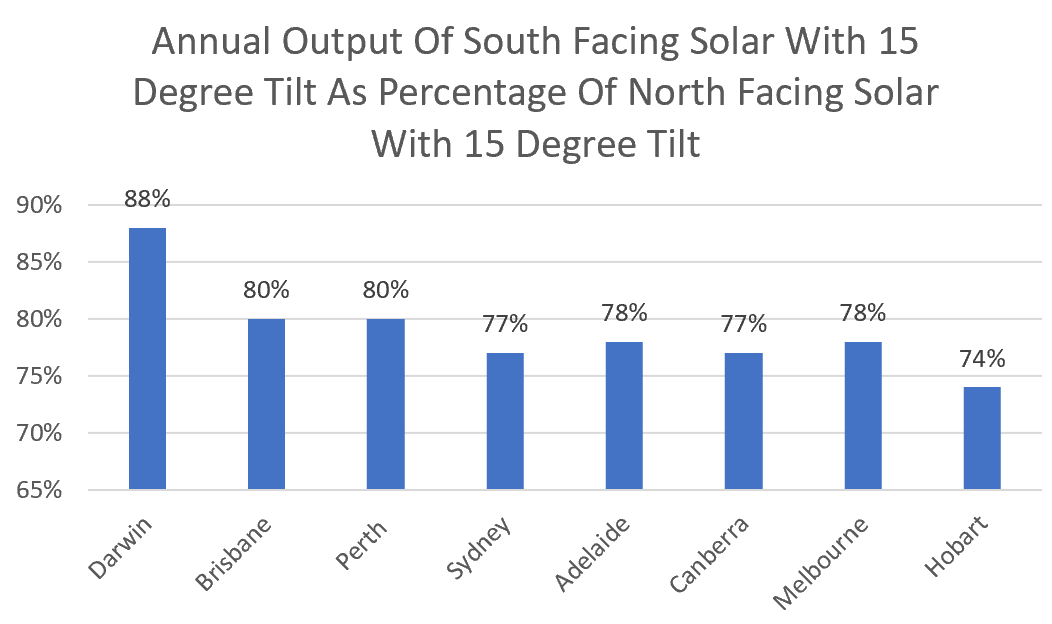
As you can see, the relative performance of south-facing panels declines the further south you go, but it’s not a smooth process. The annual output of south-facing panels is 80% of north-facing ones in Brisbane and Perth, despite Perth being 500 km further south. This is because Brisbane has cloudy summers, when south-facing panels have their highest output, while Perth summers are mostly clear and dry.
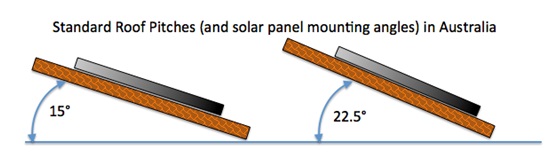
Tilt/Angle
The two most common roof tilts for Australian homes are 15 and 22.5 degrees.
The less steep the slope of your roof, the higher the annual output of south-facing panels will be. This is because panels on a south-facing roof are tilted in the opposite of the best direction. The greater their tilt, the further away from the optimal position they become. This effect also becomes worse the further south you go.
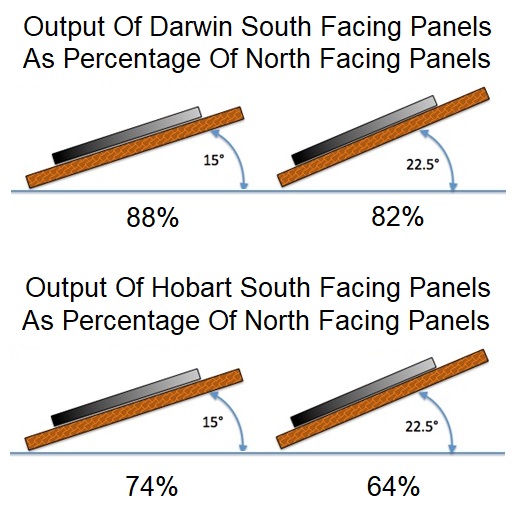
As the figure above shows, increasing the tilt of south-facing panels from 15 degrees to 22.5 causes a greater drop in output in Hobart than in Darwin.
Tilt & Output In Sydney
If I use Australia’s largest city — Sydney — as an example and make a graph of the annual output of 1 kilowatt of north-facing solar and an otherwise identical 1 kilowatt of south-facing solar, and show how the annual output changes with tilt, it looks like this:
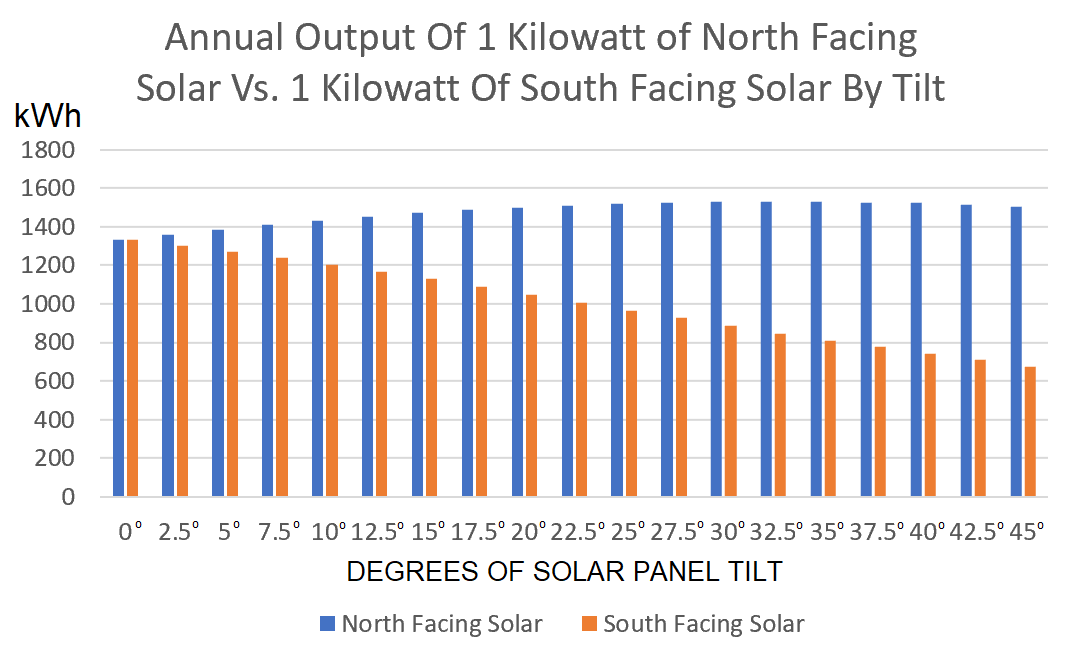
The graph shows the output of north-facing panels in Sydney slowly increases with tilt until 32.5 degrees is reached. After this, it slowly declines. This is very different from south-facing panels, which drop in output with every degree tilt is increased.
On a steep south-facing roof in Sydney with a 45º slope, panels will only produce two-thirds the annual output they would on a south-facing roof with the much more common slope of 22.5 degrees.
Tilt Racks
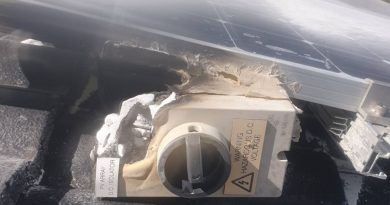
Tilt racks put legs on your solar panels so you can install them on a south-facing roof but still face them north.
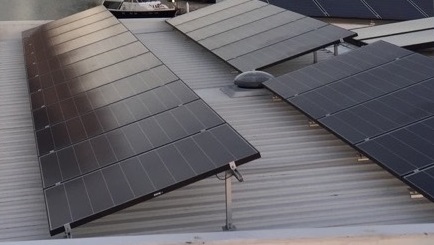
Here’s an example of the “legs” I’m referring to. You can decide for yourself whether or not they count as sexy.
If you have a flat roof, then tilt racks can be a good idea, but I don’t recommend them for angled roofs because:
- They’re not cheap.
- They can reduce the total number of panels that can fit on a roof section.
- Your local council may need to approve them.
Because solar panels cost far less than they used to, it usually makes more financial sense to install panels parallel with the roof than pay for tilt racks1.
Low Winter Output
Counter-intuitively, in some locations in summer, south-facing panels outperform north-facing ones at shallow roof angles. The graph below shows the average daily output in December for 1 kilowatt of solar PV in each capital. It compares one kilowatt of north-facing solar at 15 degrees tilt with 1 kilowatt of south-facing solar at 15 degrees tilt:
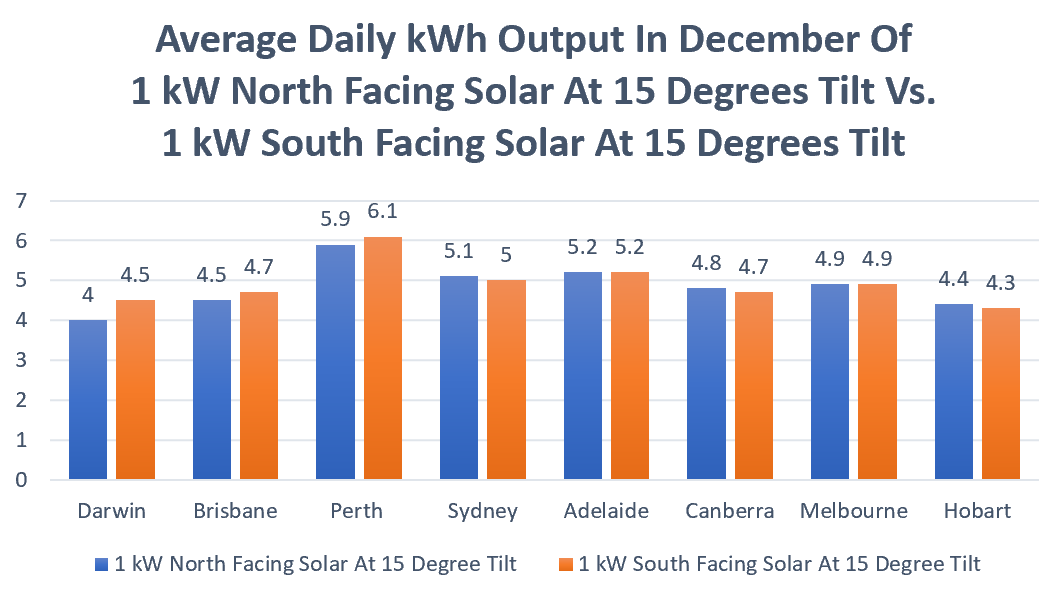
As the graph shows, the December output of south-facing panels is better than north-facing ones in Darwin, Brisbane, and Perth. In other capitals, there’s either little or no difference.
It’s a very different story in June, the worst month for solar generation in most locations. The graph below compares the average daily output in June for 1 kilowatt of north-facing solar at a 15º tilt with 1 kilowatt of south solar at a 15º tilt:
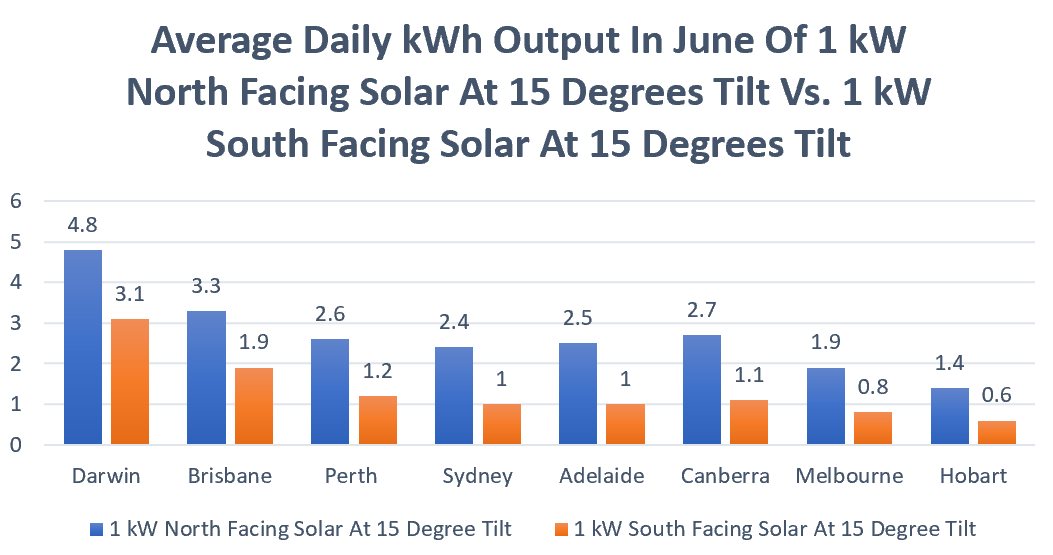
Compared to north-facing solar, south-facing winter solar generates two-thirds as much in Darwin, close to 60% in Brisbane, and under 50% in every other capital.
If your household uses more electricity for summer air conditioning than winter heating, then low winter output may not be a major problem. But in Canberra, Melbourne, and Hobart, more energy is used for winter heating than summer cooling, reducing the value of south-facing panels.
Information By Capital
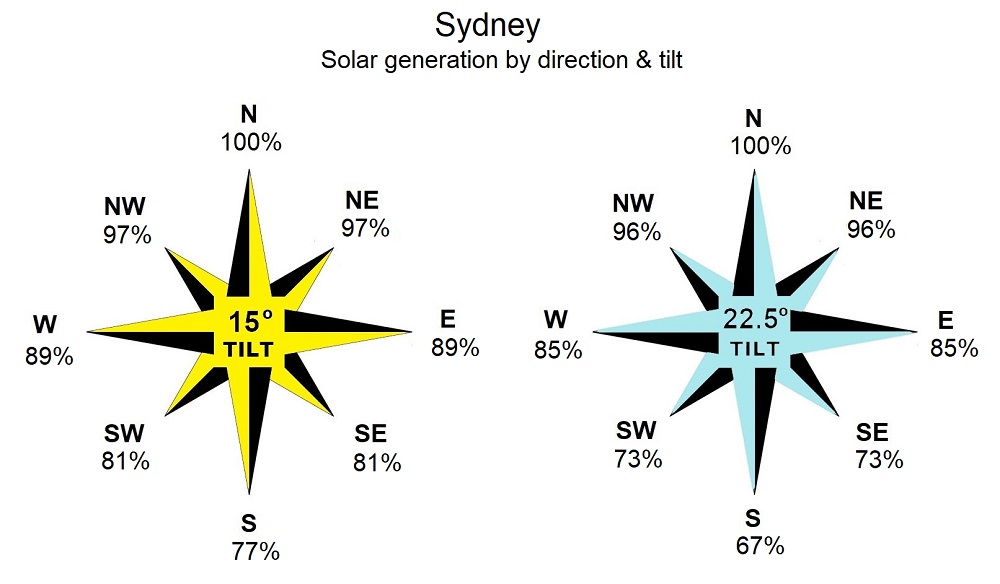
Below I’ve given information on how direction affects solar generation in each capital. I’ve used compass roses like the ones below, giving information for Alice Springs:
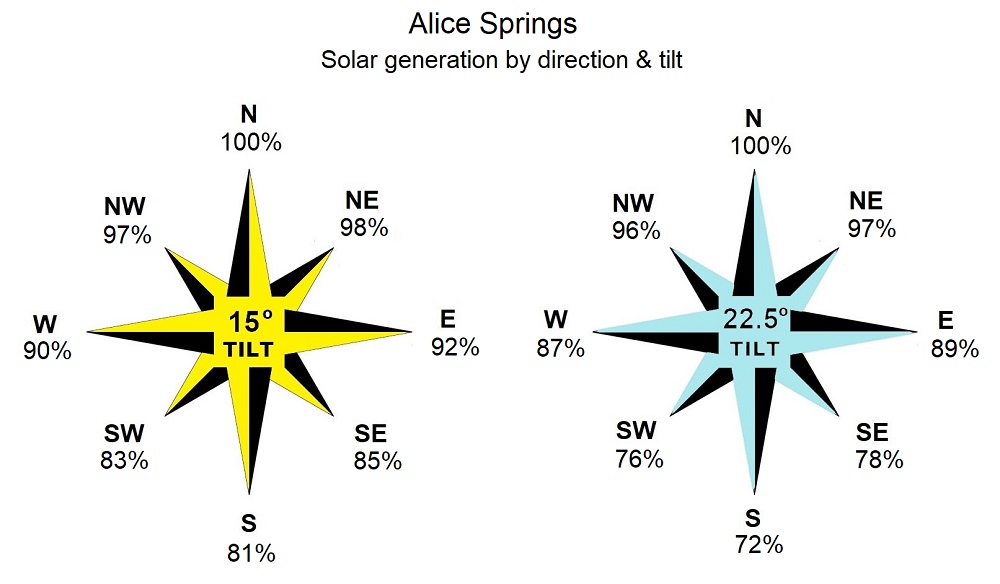
While Alice Springs is in the middle of Australia, solar there isn’t a middle of the road for Australian households. If there’s a capital closer to your location, information for it is likely to be a better guide.
The yellow compass rose is for panels tilted at 15 degrees, while the sort-of-blue one is for panels tilted at 22.5 degrees.
The percentage given for each of the eight compass directions is how much annual output panels facing that direction will produce compared to north-facing panels at that tilt.
I’ve provided percentages rather kilowatt-hour figures because — barring godlike powers — it’s not really possible to change how much sunlight a city receives. But it is possible to decide which section of roof to put solar panels on, so I decided percentages would be more useful.
I’ve also given annual and daily kilowatt-hour averages for north-facing panels in each capital. You can use the percentages to work them out for any direction if you wish.
Latitude is also provided, which indicates how far south of the equator a location is. Since most people who aren’t sailors aren’t very familiar with it, I’ve also given the figure for km from the equator for each capital.
Panels facing an easterly direction will produce more energy in the morning than in the afternoon, while panels facing a westerly direction are the opposite. Because households save more money by directly consuming solar energy rather than sending it into the grid for a feed-in tariff, the time a household consumes the most energy during the day is a consideration when deciding where to place solar panels.
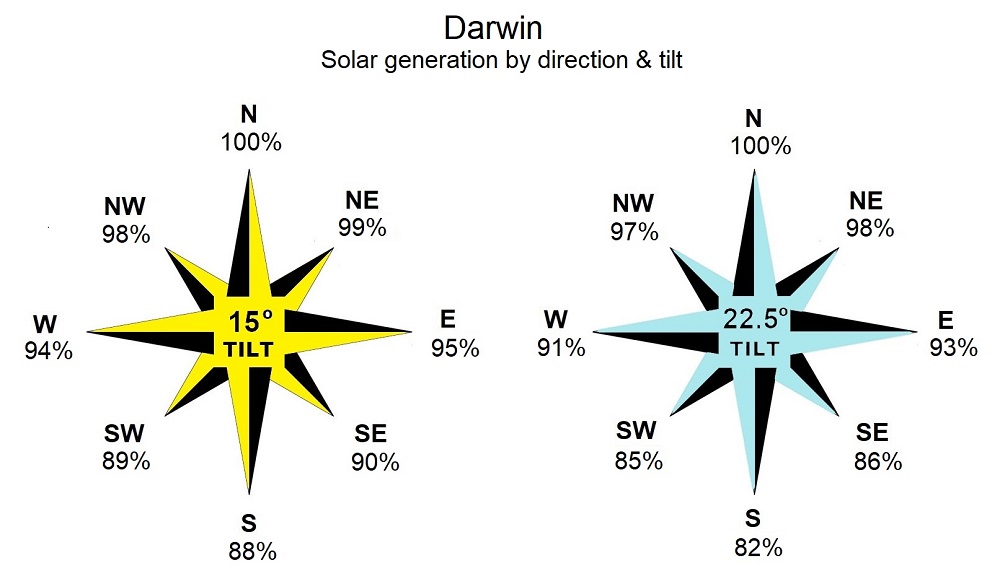
Darwin
Darwin is Australia’s most northerly city with cloudy and wet summers, while winters are clear and dry. Despite frequent cloud cover during the Big Wet, Darwin solar has the highest average output of any capital. Because of its far north location, along with local climate, there’s no real difference between the annual output of solar at 15 degrees and 22.5 degrees.
- Latitude 12°26′ Distance from equator = 1,386 km
- 1 kw north facing solar average annual output: 15° tilt = 1691 kWh 22.5° tilt = 1691 kWh
- 1 kw north facing solar average daily output: 15° tilt = 4.63 kWh 22.5° tilt = 4.63 kWh
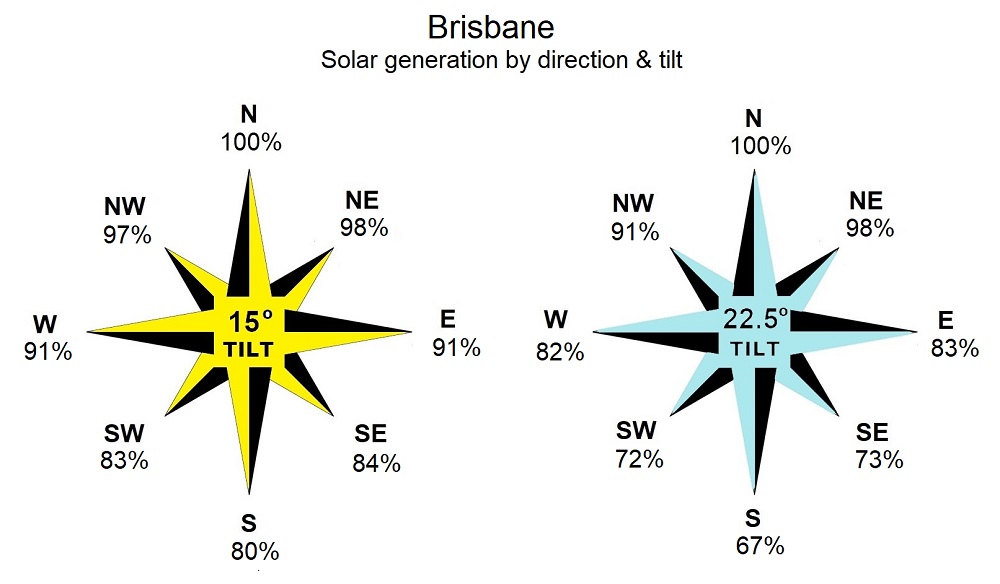
Brisbane
While not as extreme as Darwin, Brisbane also has most of its rain and cloud in summer, while winters are mostly clear and dry. It also has many birds that want to kill you.
- Latitude 27°28′ Distance from equator = 3,054 km
- 1 kw north facing solar average annual output: 15° tilt = 1,571 kWh 22.5° tilt = 1,599 kWh
- 1 kw north facing solar average daily output: 15° tilt = 4.30 kWh 22.5° tilt = 4.38 kWh
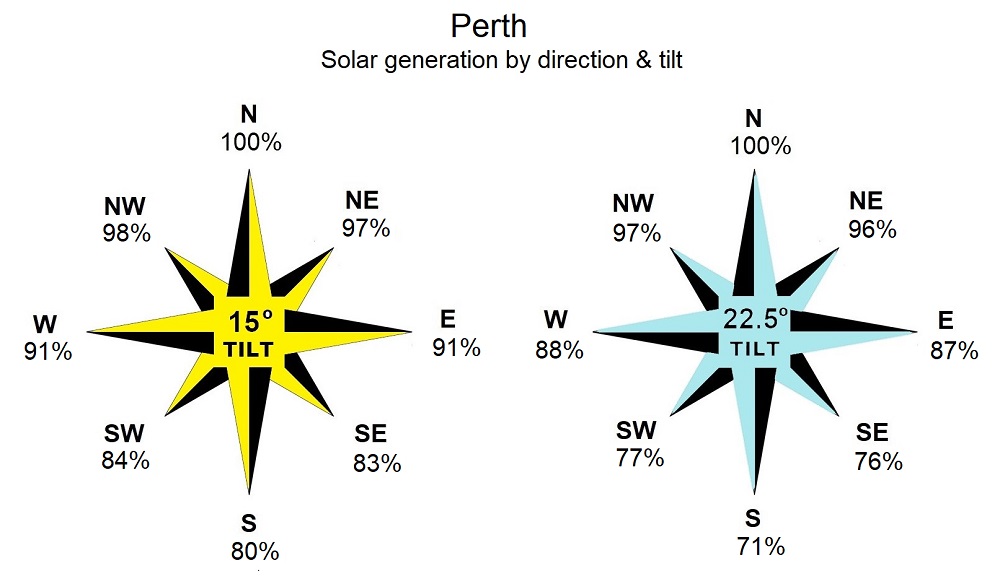
Perth
Clouds fear Perth, so solar generation is nearly as high as in Darwin over 2,000 km further north. Because only homes with solar power systems of 6.66 kilowatts or less can receive a feed-in tariff in WA, large systems are rare, and few homes have south-facing panels.
- Latitude 12°26′ Distance from equator = 3,553 km
- 1 kw north facing solar average annual output: 15° tilt = 1,655 kWh 22.5° tilt = 1,686 kWh
- 1 kw north facing solar average daily output: 15° tilt = 4.53 kWh 22.5° tilt = 4.62 kWh
Sydney
Sydney has no wet or dry season and is the even Steven of Australian capitals.
- Latitude 33°52′ Distance from equator = 3,766 km
- 1 kW north-facing solar average annual output: 15° tilt = 1,470 kWh 22.5° tilt = 1,509 kWh
- 1 kW north-facing solar average daily output: 15° tilt = 4.03 kWh 22.5° tilt = 4.13 kWh
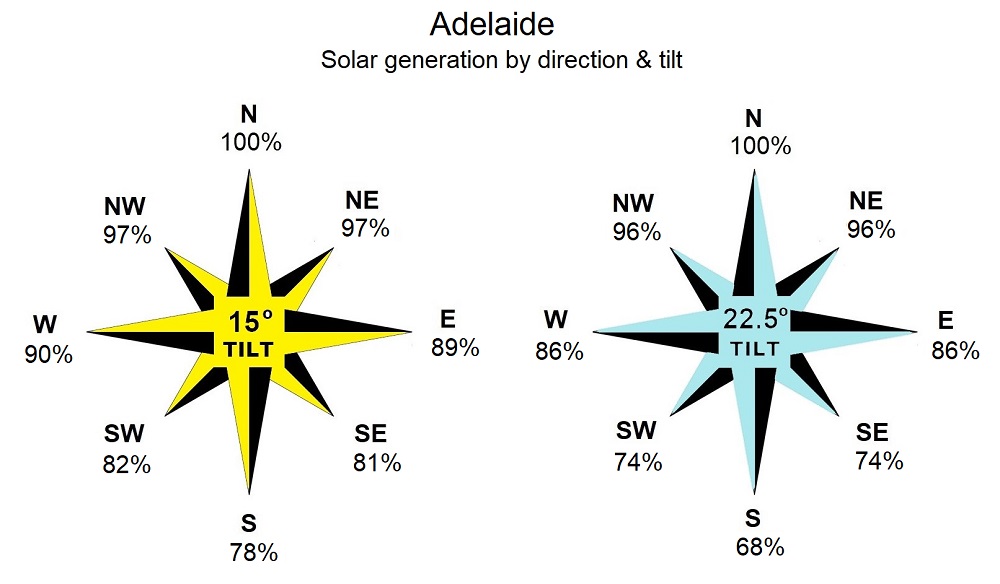
Adelaide
Clear summer skies make annual solar generation in Adelaide only modestly lower than in Brisbane, despite being much further south.
- Latitude 34°56′ Distance from equator = 3,884 km
- 1 kw north facing solar average annual output: 15° tilt = 1,477 kWh 22.5° tilt = 1,513 kWh
- 1 kw north facing solar average daily output: 15° tilt = 4.05 kWh 22.5° tilt = 4.15 kWh
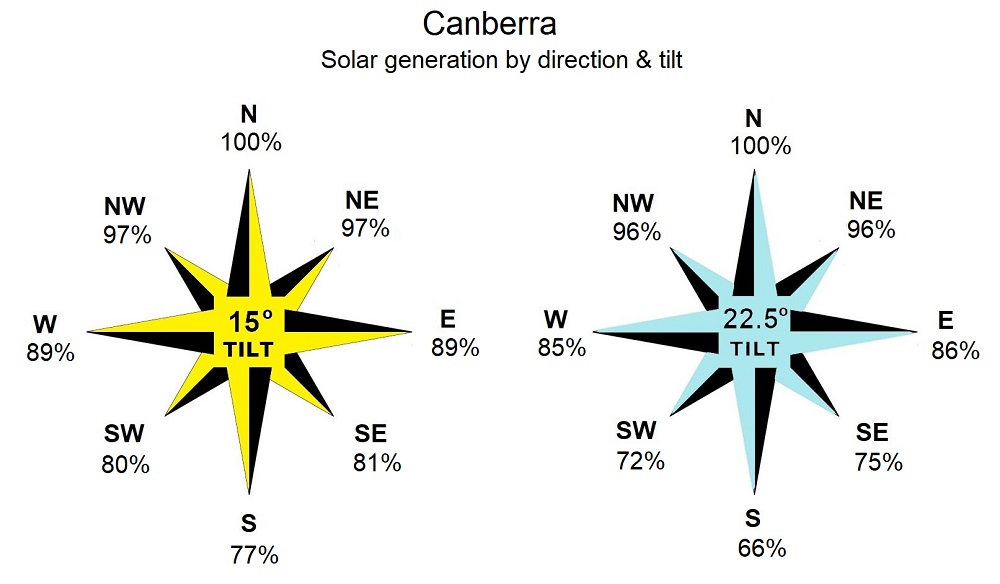
Canberra
Overall, solar output is high in Canberra. However, the winter output of south-facing panels is meagre, which is a pity because it can get damned cold there.
- Latitude 35°18′ Distance from equator = 3,923 km
- 1 kw north facing solar average annual output: 15° tilt = 1,482 kWh 22.5° tilt = 1,523 kWh
- 1 kw north facing solar average daily output: 15° tilt = 4.06 kWh 22.5° tilt = 4.17 kWh
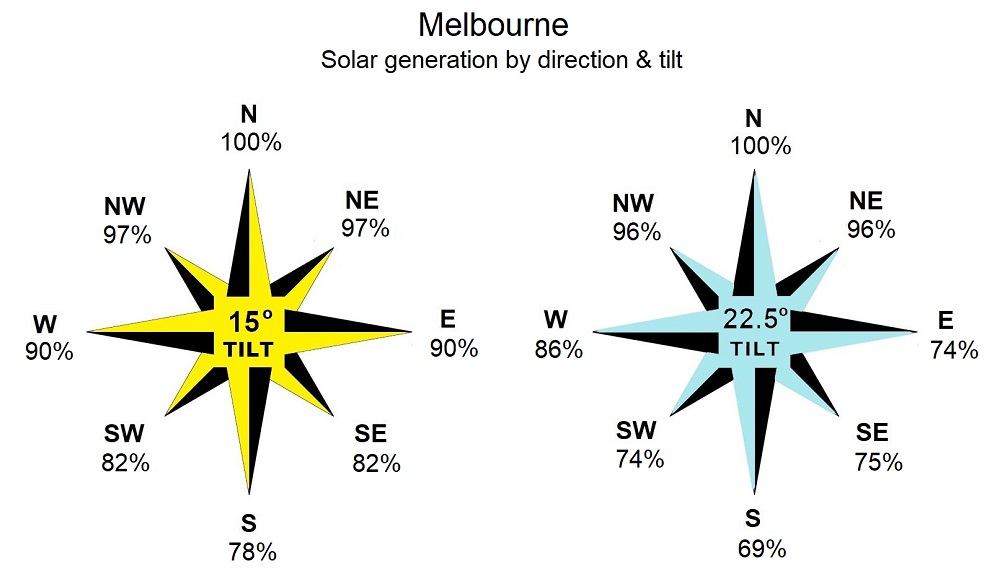
Melbourne
Melbourne is the cloudiest capital on the mainland. The weather there has no idea what it’s doing from one hour to the next, but at least it’s not boring.
- Latitude 37°49′ Distance from equator = 4,205 km
- 1 kw north facing solar average annual output: 15° tilt = 1,329 kWh 22.5° tilt = 1,362 kWh
- 1 kw north facing solar average daily output: 15° tilt = 3.64 kWh 22.5° tilt = 3.73 kWh
Hobart
Hobart is Australia’s most southerly city and has the lowest solar output of any capital. Fortunately, not low enough to prevent solar power from being worthwhile.
- Latitude 42°53′ Distance from equator = 4,768 km
- 1 kw north facing solar average annual output: 15° tilt = 1,152 kWh 22.5° tilt = 1,142 kWh
- 1 kw north facing solar average daily output: 15° tilt = 3.16 kWh 22.5° tilt = 3.13 kWh
Can South Facing Panels Pay?
Yes. They can.
The easiest way to work out if south-facing solar is likely to pay is to use the SolarQuotes Solar & Battery Calculator. If you enter the relevant details, it will handle all the calculations and estimate a solar system’s simple payback time. This is how long it will take the savings on electricity bills to equal the cost of a solar power system.
What payback period is enough to make solar worthwhile is something people have to decide for themselves2, but I think the return from south-facing solar on a typical unshaded roof anywhere in Australia should be good enough to appeal to the majority of people who don’t owe money to the mafia.
Determining Payback Period
Our Solar & Battery Calculator lets you enter…
- The direction — or directions — your solar panels will face.
- The slope of the roof.
- The cost of grid electricity
- The solar feed-in tariff.
- The cost of the system.
- How much you spend on electricity per year.
- Whether or not you have a battery.
This is a considerable amount of information to input. Still, it automatically provides default values for a typical household, so if you’re happy with them, it makes things a lot faster.
To get an estimate of the simple payback time of south-facing solar in every capital, I’ll have to consider…
- System size
- Panel direction and tilt
- Cost
- Electricity prices, and…
- Solar feed-in tariffs
System Size: I’ll assume a system with 6.6 kilowatts of panel capacity will be installed. In some locations, this is the maximum homes with single-phase power can install.
Direction and tilt: The system will face directly south and tilted at 23 degrees. Few solar power systems have all their panels facing south, but I’m assuming a worst-case situation for direction.
Cost: I’ll assume the system costs $6,000. This won’t pay for the best panels or inverter available but can cover a system composed of reliable components from an installer who does quality work.
Electricity Prices: To get an accurate estimate of the payback period, you should enter what you expect to typically pay for electricity during the day with the electricity plan you will have after you get solar installed. It may be necessary to estimate the amount. I’ll use the default values for my estimate for each capital.
Solar feed-in tariff: I will use our Solar & Battery Calculator’s default value for solar feed-in tariffs. In every state except WA, the default assumes the feed-in tariff will decrease by 1 cent a year down to a minimum of 6 cents. Western Australia doesn’t have this automatic reduction because their feed-in tariff is already close to rock bottom. I expect solar feed-in tariffs will rise over the next couple of years as the world economy recovers, but — to err on the side of caution — I will use the default values with the automatic reduction.
Other factors: For everything else, I’ll leave the defaults as they are. This includes solar electricity self-consumption based on the size and panel position for a typical home.
After entering the details into the Solar & Battery Calculator, it gave me the following payback periods in years for each capital:
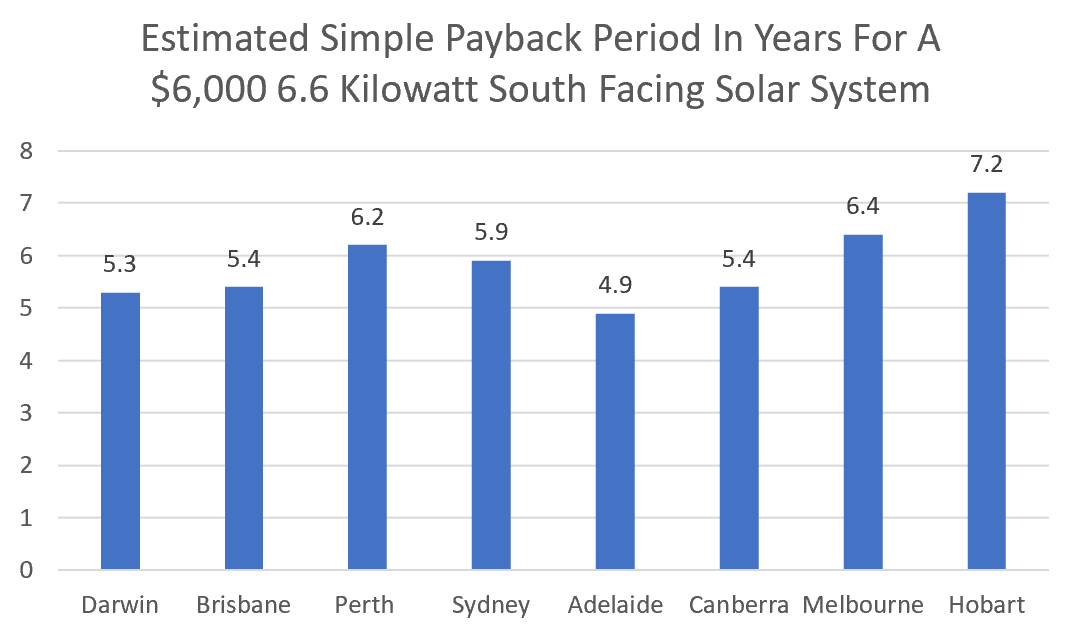
The longest simple payback for south-facing solar is 7.2 years in Hobart. This isn’t surprising, as that city has the lowest solar output in Australia, and south-facing panels perform poorly there. But, while its payback period is the longest, it’s still not a bad investment for many Tasmanians. The old rule of thumb for business was a payback period of 7 years for an investment was worthwhile. This is now out of date, as the period has become longer. Whether or not it’s worthwhile for a household will come down to individual preferences. If you know you’re likely to stay in a home for more than seven years, I’d say you have little to lose. Even if you leave before it has paid for itself, a good solar power system will add to your home’s value.
The second-longest payback period is in Melbourne at 6.4 years. This is partly due to the climate, but also thanks to low electricity prices. But there is a Victorian Solar Rebate of up to $1,400 currently available I did not include. With that, the payback period falls to 3.8 years.
Adelaide has the shortest payback period of any capital — if the Victorian rebate is ignored. While not a great location for south-facing solar, high electricity prices and feed-in tariffs allow rapid payback.
Not As Good As Other Directions — But Often Worthwhile
For various reasons, including simply having plenty of roof space in a better direction, south-facing solar won’t suit everyone. But whether your goal is to…
- Save the planet.
- Save money.
- Have plenty of solar generation, so you’re prepared for when you get a home battery, electric car, increase consumption or ditch your gas connection.
Then south-facing solar can make plenty of sense. If you have a suitable south-facing roof without significant shading and can install solar panels there without undue difficulty, then I say fill your roof with solar.
Footnotes
- This is especially true because the STCs that reduce the up-front cost of solar are based on total panel capacity. This means it typically makes more financial sense to increase the size of the system than use tilt racks to improve the output of panels. (I feel bad now as if I’d just told my brother how to exploit a bug to cheat in a computer game…) ↩
- People should aim not to chase the shortest payback period but install the system, which is the best investment overall. This is usually a system much larger than one which has the shortest payback time. ↩
Original Source: https://www.solarquotes.com.au/blog/south-facing-solar-panels/
Related Posts:
 Do I Need a New Roof to Go Solar?
- What’s the Best Direction for Solar Panels to Face?
- NC Supreme Court rules that HOAs cannot deny…
- Mitrex releases solar panel designs that mimic roof style
- Duke Energy Florida completes 700-MW solar…
- There’s No Such Thing As A Badly Oriented Roof For Solar
- CEC Pushes To Add Home Batteries To Solar Rebate Scheme
- Palmetto to add rooftop solar to 207-home South…


