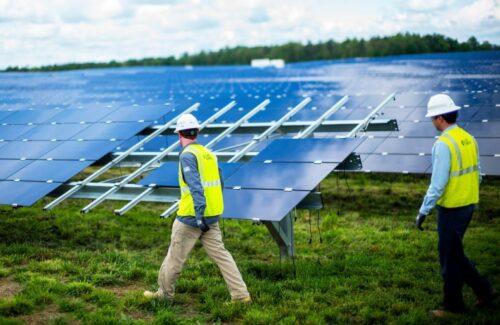
Renewables added 2,400 MW of new generating capacity each month in 2021

Credit: Duke Energy
According to a review by the SUN DAY Campaign of data newly released by the Federal Energy Regulatory Commission (FERC) and the U.S. Energy Information Administration (EIA), solar, wind and other renewable energy sources (biomass, geothermal, hydropower) provided 81.07% of new domestic electrical generating capacity in 2021.
According to the latest issue of FERC’s” Energy Infrastructure Update” (with data through December 31, 2021), utility-scale (greater than 1-MW) renewable facilities added 23,639 MW of new generating capacity last year with solar and wind providing 12,804 MW and 10,754 MW respectively. Small additions were also provided by hydropower (28 MW) biomass (28 MW), and geothermal (25 MW). These numbers are preliminary and, based on the pattern of past years, are likely to grow in subsequent reporting.
Separately, in its latest “Short-Term Energy Outlook,” EIA reports that the U.S. electric power sector added 14,000 MW of new wind capacity and 13,000-MW of utility-scale solar capacity in 2021. EIA also notes that small-scale (less than 1-MW), distributed solar grew by about 5,100 MW last year.
Thus, utility-scale renewables plus distributed solar provided on average roughly 2,400 MW or more of new generating capacity each month in 2021. For perspective, that is more than the planned generating capacity (2,200 MW) of the two reactors at the Vogtle nuclear plant in Georgia that have been under construction since 2013 and for which there is still no certain completion date.
Even FERC’s more modest numbers indicate that new renewable capacity in 2021 was more than four-times greater than that of natural gas (5,489 MW). There was no new nuclear capacity added in 2021 while new oil and coal capacity increased by just 19 MW and 11 MW respectively.
Renewables now provide more than a quarter (25.81%) of total U.S. available installed generating capacity — a share significantly greater than that of coal (18.49%) and more than three-times that of nuclear power (8.29%). By comparison, a year ago, renewables’ share was only 24.06%. Five years ago, it was 19.17% and a decade earlier it was 14.26%.
That growth is almost entirely attributable to a nearly three-fold increase in wind’s share of installed generating capacity and a 32-fold increase in solar’s share over the past ten years. Wind is now more than a tenth (10.68%) of the nation’s generating capacity (up from 3.93% in December 2011) while utility-scale solar has surpassed five percent (5.44%) — up from 0.17% in December 2011, and that does not include small-scale distributed solar.
In addition, FERC data suggest that the share of generating capacity from solar and wind is on track to increase significantly over the next three years (by December 2024). FERC notes that there may be as much as 180,875-MW of new solar capacity in the pipeline with 53,812 MW classified as “high probability” additions and no offsetting “retirements.” The “high probability” additions alone would nearly double utility-scale solar’s current installed capacity of 67,780 MW while successful completion of all projects in the pipeline would more than triple it.
In addition, new wind capacity by December 2024 could total 76,822 MW with 21,577 MW being “high probability” and only 150 MW of retirements expected. Thus, installed wind capacity could grow by at least 16% and possibly by nearly 60%.
“High probability” generation capacity additions for utility-scale solar and wind combined, minus anticipated retirements, reflect a projected net increase of 75,239 MW over the next three years, or almost 2,100 MW per month. Again, that figure does not include new distributed, small-scale solar capacity or additions by hydropower, geothermal, and biomass. By comparison, net growth for natural gas will be only 11,990 MW. Thus, solar and wind together are forecast to provide more than six times as much new net generating capacity as natural gas by December 2024, not to mention almost 350 times as much net new capacity as nuclear power (projected to add only 218 MW).
If just FERC’s latest “high probability” projections materialize, by December 2024, renewable energy sources should provide over 30% (30.51%) of the nation’s total available installed generating capacity with utility-scale solar and wind accounting for 9.34% and 11.86% respectively, or more than one-fifth (21.28%) combined.
Meanwhile, over the next three years, coal’s share of total installed generating capacity will drop by 27,579 MW, reducing its share from 18.49% to 15.57%; that of gas will fall from 44.16% to 43.15%; and nuclear power’s contribution will decline from 8.29% to 7.95%.
“FERC’s and EIA’s 2021 data once again confirm that the transition away from fossil fuels and nuclear power is well underway, led by the breath-taking growth of solar and wind,” said Ken Bossong, executive director of the SUN DAY Campaign. “Given those agencies’ habit of low-balling renewable energy growth, even their strong forecasts for renewable energy over the next few years are likely to be surpassed.”
News item from the SUN DAY Campaign
<!–
–>
Original Source: https://www.solarpowerworldonline.com/2022/03/renewables-added-2400-mw-new-generating-capacity-each-month-2021/


