
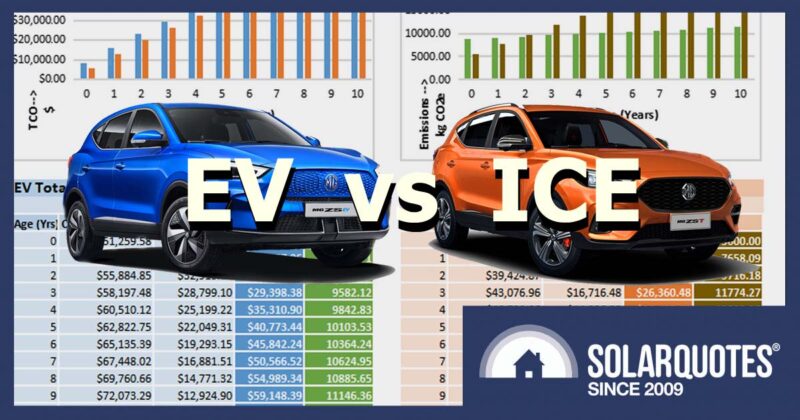
Are EVs Worth It In Australia? Let The Numbers Decide, With Our Free, Nerdy Excel Tool

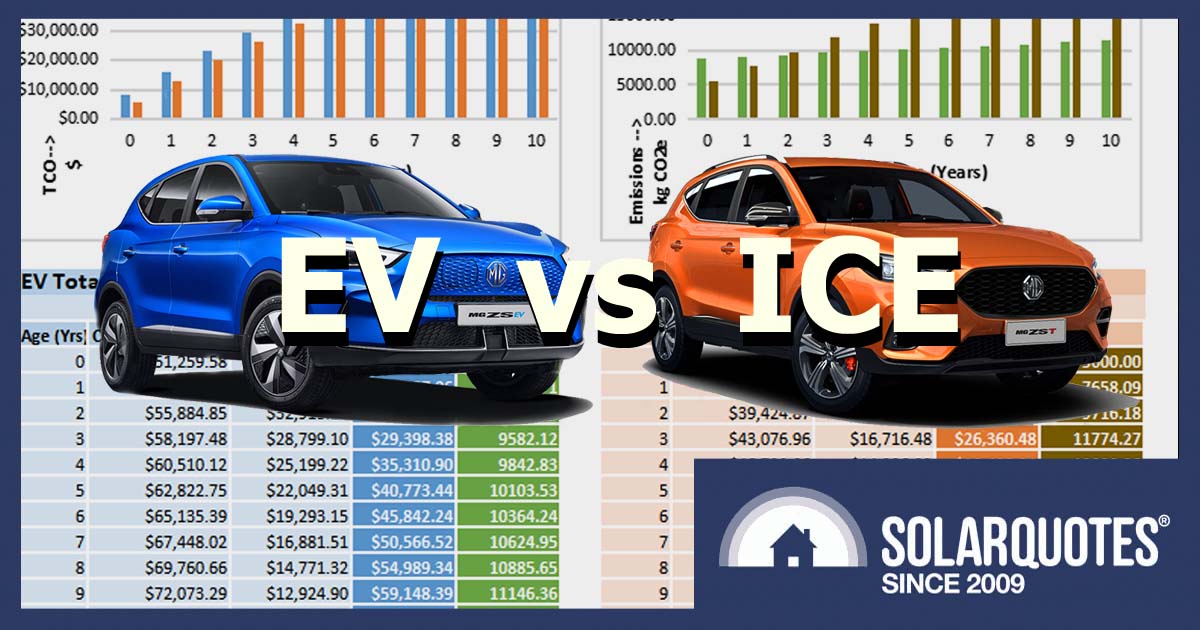
Unsure if EVs are the right fit for you? We’ve got you covered. This article presents an advanced Total Cost of Ownership (TCO) and emissions calculator to compare EVs and internal combustion engine (ICE) vehicles, available via a link at the end. And yes, we’re talking about emissions too! After all, that’s what kick-started the EV revolution. But for those focused on the bottom line, fear not – this calculator mostly focuses on dollars.
Our powerful Excel-based calculator shows you the true cost of electric vehicle (EV) ownership in Australia. Don’t be fooled by the higher upfront cost – evaluating TCO over the vehicle’s life cycle reveals the real financial impact on your wallet and the atmosphere.
So dive into the numbers and make an informed decision about when you should embrace the electric future.
How Does It Work?
Pretty simple.
Worked Example
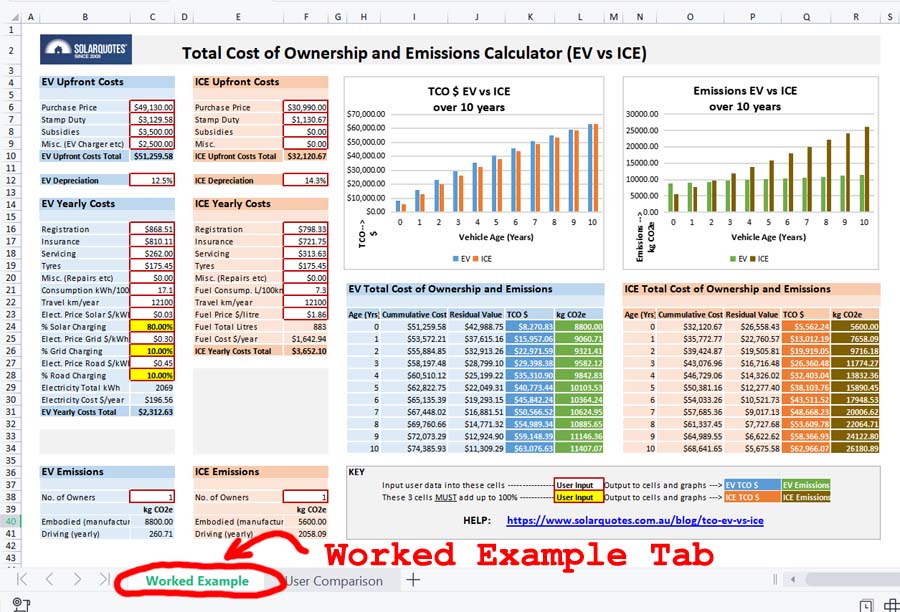
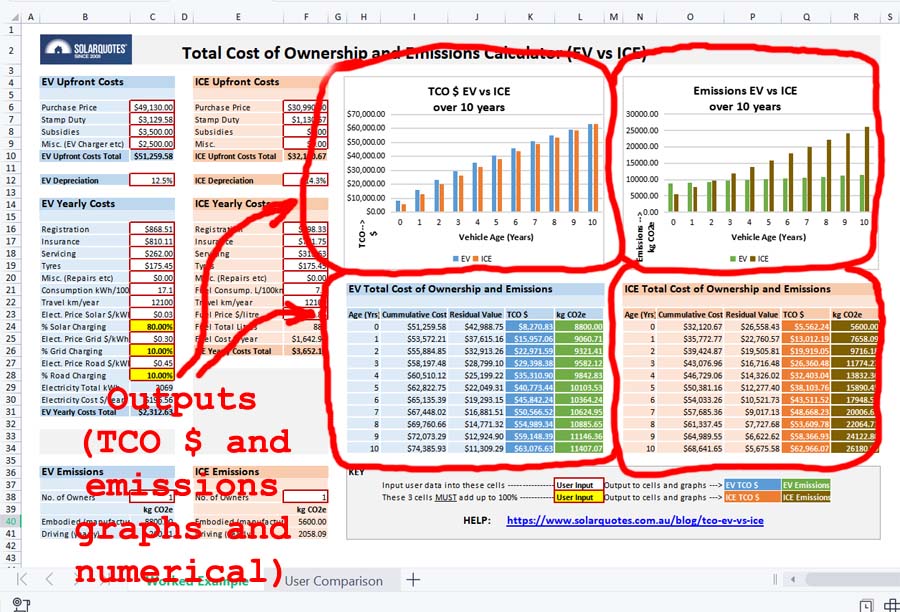
There’s a “Worked Example” on the first tab of the Excel spreadsheet which is locked and uneditable. The figures, based on two comparable vehicles, are already entered in, and then output to two graphs – one for TCO $, and the other for emissions.
The full methodology for the example is provided further in this article to not only show full transparency and methodology but also to help you enter your own data into the next tab – “User Comparison”.
User Comparison
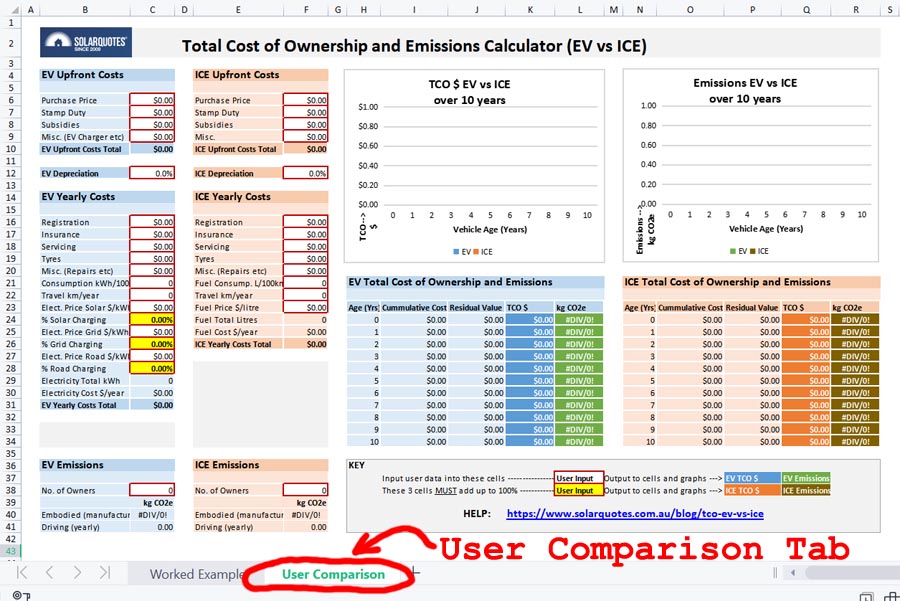
This is where the fun starts. Click on the “User Comparison” tab at the bottom of the spreadsheet. You can enter your own figures here and compare any vehicles you like – even used ones, but remember – garbage in, garbage out.
Simply enter your data into the following cells marked with a red border:
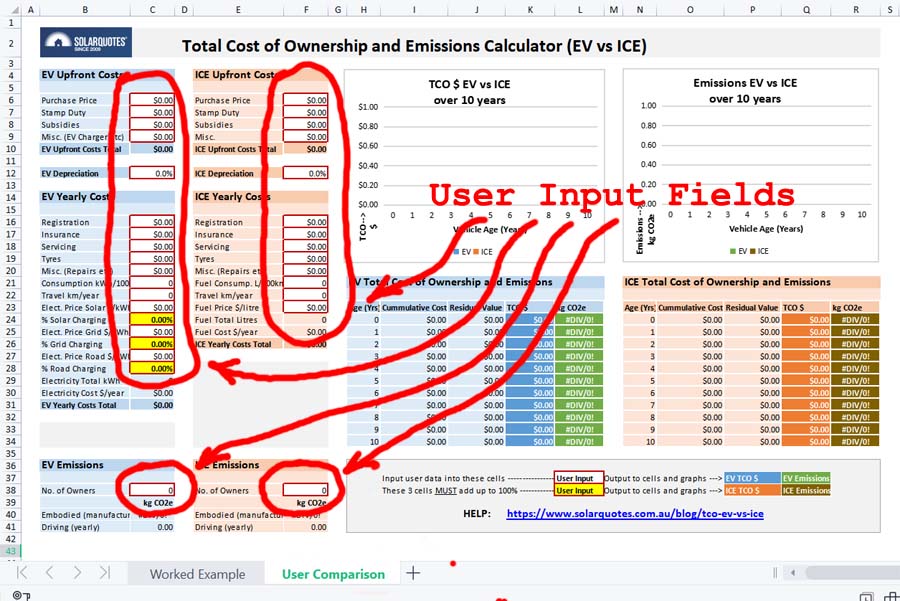
- Purchase Price
- Stamp Duty
- Subsidies
- Misc. (EV Charger etc)
- Depreciation
- Inflation
- Registration
- Insurance
- Servicing
- Tyres
- Misc. (Repairs etc)
- Consumption kWh/100km (EV)
- Travel km/year
- Elect. Price Solar $/kWh (EV)
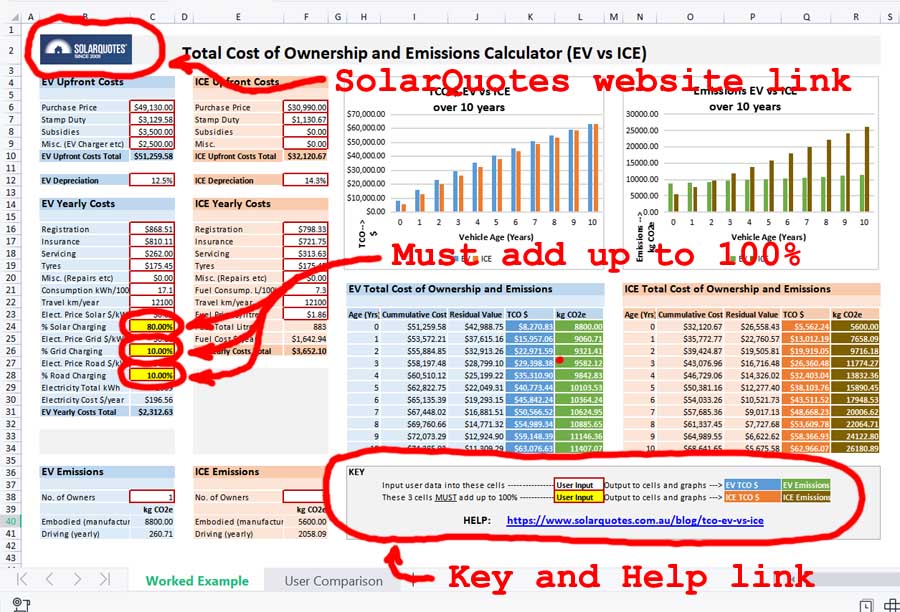
- % Solar Charging (EV) – this is 1 of 3 cells that must add up to 100%
- Elect. Price Grid $/kWh (EV)
- % Grid Charging (EV) – this is 1 of 3 cells that must add up to 100%
- Elect. Price Road $/kWh (EV)
- % Road Charging (EV) – this is 1 of 3 cells that must add up to 100%
- Fuel Consump. L/100km (ICE)
- Fuel Price $/litre (ICE)
- No. of Previous Owners
The calculator will crunch the numbers and automatically output TCO $ and emissions to the cells on the right-hand side, and also conveniently shown in the graphs in the top right corner.
Help
If it all goes pear-shaped there’s a key in the bottom right corner to show you where to input your data. There’s also a link back to this article which doubles as a help page, and also a link in the top left corner back to the SolarQuotes website.
Conclusion
To spare some of you the boredom of reading through the full methodology used to calculate the worked example, I’ve shuffled the conclusion further up the order. Read it below, then either carry on and read the methodology or scroll to the bottom to download the calculator.
1. A vehicle travelling higher than average km/ year will tip the scales more favourably towards an EV being more cost-effective and less emission-intensive than an ICE vehicle over the life-cycle of a vehicle. This is quite ironic, considering the best economic and environmental outcome would be achieved by walking or riding your bike and driving your car less!
2. In addition to the above, the longer a vehicle stays in service will shift the odds towards an EV being more economic and less emission-intensive than an ICE vehicle over the life-cycle of a vehicle.
3. Currently, charging an EV from excess solar only has a marginally better economic outcome than charging from the grid or road. This is because electricity accounts for less than 10% of an EVs yearly costs. Charging from excess solar, however, gives a far greater environmental benefit than charging from fossil fuel-intensive grids.
4. A higher inflation rate favours EVs over ICE vehicles for value because the higher upfront cost is paid earlier, and subsequent yearly costs are lower for an EV. In addition, fuel and energy prices are likely to rise more than inflation. The fuel component of an ICE vehicle comprises 45% of yearly costs. In contrast, the fuel (electricity) component of an EV comprises less than 10%. Therefore, the effect of fuel/ energy price rises over time GREATLY favours EVs economically over ICE vehicles.
5. When comparing a new EV with a used ICE vehicle – running your old petrol clunker into the ground might save you money for a while, but will produce the highest emissions and achieve the worst environmental outcome.
6. The Federal Government’s fringe benefits tax exemption1 for Battery and Hybrid EVs can substantially change the TCO as you can pay for the repayments, servicing, tyres and electricity for an EV with pre-tax money at no cost to an employer.
7. Two elephants in the room – Although embodied emissions from both the mineral supply chain and vehicle decommissioning have been taken into account, there’s no denying that we have a huge challenge dealing with (1) demand vs supply of raw materials, and (2) recycling of EV batteries.
8. All forms of energy production and consumption have environmental impacts. There is no perfect technology. Using this calculator may help in choosing the lesser of two evils.
Read on for the full methodology used in the worked example, or if you can’t wait, scroll down to the bottom of the article and download the calculator to do your own analysis.
Methodology for Worked Example
The following is the methodology used for the figures entered into the locked (uneditable) “Worked Example” tab using two comparable vehicles in Western Australia.
Upfront Costs
Purchase Price
The cheapest brand-new EV in Australia at the time of writing2 is the MG ZS EV, which is an electric version of an MG ZST. These are the current prices:
2023 MG ZS EV Excite – $49,130
2023 MG ZST Excite – $30,990
Stamp Duty
In Western Australia for all vehicles, $25,000 – $50,000 the stamp duty payable is:
R% of the dutiable value, where R = [2.75 + ((dutiable value – 25,000)/ 6,666.66)] rounded to 2 decimal places
MG ZS EV Excite calculation:
[2.75 + ((49,130 – 25,000)/6,666.66)] = 6.37% x $49,130 = $3,129.58
MG ZST Excite calculation:
[2.75 + ((30,990 – 25,000)/6,666.66)] = 3.65% x $30,990 = $1,130.67
Subsidies
Zero Emission Vehicle (ZEV) Rebate – $3,500
The WA government currently offers a $3,500 rebate for the first 10,000 purchasers of licensed electric and hydrogen vehicles in WA, or for 3 years following the announcement (until Saturday 10 May 2025), whichever comes first.
Misc. (EV Charger etc)
The current average price for a 7.4kW Tesla Gen 3 Wall Connector level 2 single-phase EV charger supplied and installed in WA is approximately $1,800.
Depreciation
Depreciation rates vary for different vehicles depending on factors such as current market demand, make, model, age, etc.
It’s commonly thought that EVs depreciate slower than their petrol counterparts, but it depends on which so-called authority you believe, or which website you read. The estimates vary widely. The vehicle manufacturers certainly seem to support this theory, based on the warranty given for each vehicle. I’ve therefore assumed they depreciate using the length of the manufacturer’s warranty by the following method:
The ATO general depreciation rules – capital allowances, allow the prime cost method or diminishing value method to calculate vehicle depreciation for tax purposes. The prime cost method is the simpler one and uses the following formula:
Asset’s cost × (days held ÷ 365) × (100% ÷ asset’s effective life)
EV Depreciation
Assuming the asset’s (EV’s) life is the length of the battery warranty – 8 years/160,000 km, whichever comes first, that works out to a depreciation rate of 12.5% per annum over 8 years.
ICE Depreciation
Assuming the asset’s (ICE’s) life is the length of the vehicle warranty – 7 years/70,000 km, whichever comes first, that works out to a depreciation rate of 14.3% per annum over 7 years.
The graph, however shows depreciation over 10 years because the most recent Motor Vehicle Census by the Australian Bureau of Statistics (January 2021) shows the average age of registered vehicles as 10.6 years.
Inflation
According to the Reserve Bank of Australia (RBA), since the introduction of inflation targeting in the early 1990s, inflation has averaged 2.5% per year. This inflation figure is used to calculate yearly costs each year (columns I and P).
Note that fuel and energy costs are predicted to rise faster than inflation, however, this is not accounted for in the calculator.
Yearly Costs
Registration
WA is the only Australian state to use weight in calculating individual light vehicle license fees. The registration is comprised of the following:
License fee – $25.52 per 100kg vehicle Tare mass
Motor Injury Insurance – $457.55
Recording fee – $10.30
MG ZS EV Excite – $868.51
MG ZST Excite – $798.33
Insurance
Based on quotes from RAC for fully comprehensive insurance with $500 excess, driving between 10,000 and 15,000km per year, single driver, with no claim bonus.
MG ZS EV Excite – $810.11
MG ZST Excite – $721.75
The insurance cost will diminish over time as the asset’s residual value diminishes, although it will remain higher than the rate of depreciation. Since the diminishing insurance rate will be equal for all vehicles, it hasn’t been considered in this calculator.
Servicing
MG capped-price service costs for Australia for 7 years (new car warranty period).
MG ZS EV Excite – average $262.00
MG ZST Excite – average $313.63
Tyres
ICE Vehicle
According to RAC and NRMA, generally speaking, tyres for an ICE vehicle last around 40,000km. This varies greatly due to individual driving styles and tyre pressure.
40,000km divided by 4 tyres = 10,000km per year per tyre. Assuming the average km traveled per year is 12,100km, it works out to an average of 1.21 tyres replaced per year for an ICE vehicle.
MG ZST Excite – $175.45
EV
Hyundai Motor group claims that EV tyres wear 20% faster than those of ICE vehicles due to the acceleration of electric vehicles that generate strong instantaneous power (torque).
40,000km (above) less 20% = 32,000km divided by 4 tyres = 8,000km per year per tyre – an average of 1.51 tyres replaced per year for an EV assuming average km travelled.
MG ZS EV Excite – $218.90
Miscellaneous (Repairs etc)
This field can be used for any miscellaneous yearly costs, ranging from anticipated repairs to estimated fringe benefits tax, etc.
EV Consumption kW/100kWh
17.1 kWh/100km – according to the MG ZS EV technical specifications based on the Worldwide harmonised Light-vehicles Test Procedure (WLTP) combined city and highway cycle.
ICE Fuel Consumption L/100km
7.3 L/100km – according to the MG ZST technical specifications (combined city and highway cycle).
Travel km/year
From the ABS Survey of Motor Vehicle Use in Australia 2020, the average kilometres traveled was 12,100km for all vehicles. This figure didn’t vary significantly across states.
Elect. Price Solar $/kWh
Using excess solar to charge an EV is not actually free, because you usually have to account for the relinquished feed-in tariff you would have otherwise received.
In WA, Synergy FiT is called the Distributed Energy Buyback Scheme (DEBS) = $0.025/kWh (off-peak rate).
Elect. Price Grid $/kWh
In WA, Synergy A1 Tariff = $0.30/kWh.
Elect. Price Road $/kWh
In WA, the RAC Electric Highway electric vehicle charging station network costs $0.45/kWh.
% Charging
When entering data into these 3 cells they MUST add up to 100% for the calculator to be accurate.
Fuel Price $/litre (unleaded)
According to WA Govt Dept of Mines, Industry Regulation & Safety the overall average price for ULP in Perth in 2022 was $1.86/Litre.
Total Cost of Ownership (TCO) Calculations
This figure is simply the Cumulative Cost less the Residual Value of the vehicle each year. The result is also output to the graph for EV and ICE vehicles. Note that there are other ways of calculating TCO which end up with the same result.
Yearly Cost
Yearly costs in year 0 (at the time of purchase) are registration and insurance. Year 1 uses the Total Yearly Costs (C34 and F29) x the inflation rate (C14). Year 2 onwards uses the previous year’s yearly costs x the inflation rate.
Cumulative Cost
Cumulative Cost (each year) = Cumulative Cost (previous year) + Yearly Costs Total
Residual Value
Residual Value (of the vehicle each year) = Residual Value (previous year) less (Depreciation x Residual Value (previous year).
In addition, the Residual Value on day one (Year 0) of ownership takes into account that the car has dropped its value by the annual depreciation percentage as soon as it is driven out of the car yard. This is the reason the TCO in Year 0 is so high.
Emissions
Calculating full life-cycle or cradle-to-grave emissions for any vehicle is complex. It consists of tailpipe emissions, fuel/ electricity production and transport, emissions created in the mineral supply chain, and vehicle decommissioning. Many recent studies have been undertaken, and although the figures vary, they all agree on two main findings. (1) Currently EV manufacturing creates more emissions than comparable ICE vehicles. (2) Despite this, EVs have a significantly lower carbon footprint over the full life cycle.
No. of Previous Owners
This is to specify whether the car is bought new, or used (one owner, etc). The embodied (manufacture) emissions are divided between the number of owners over the calculation period. It doesn’t mean the number of owners as a couple or family buying the vehicle!
No. of Previous Owners = 0 (you bought the car brand new)
No. of Previous Owners = 1 (you bought the car used from the brand new owner)
Embodied Emissions (manufacture including mineral supply chain and decommissioning)
Calculated using the Final Report for the European Commission 13-07-2020 “Determining the environmental impacts of conventional and alternatively fueled vehicles through LCA”
The report states – For a standard mid-sized gasoline ICE (internal combustion engine) vehicle the embedded carbon in production will be around 5.6tCO2e. A similar electric vehicle will have embedded production emissions of 8.8tCO2e.
Note that this study takes into account in its scope a life-cycle inventory including “all the raw materials”, “all the energy inputs”, “all the by-products and wastes”, and “all emissions to land, water, and air.”
Driving (Yearly) Emissions
This, as specified in ISO (International Organization for Standardization) 14064, includes tailpipe emissions (or lack of), plus emissions created by producing and transporting fuel and/or electricity.
Electric Vehicle
As specified in ISO (International Organization for Standardization) 14064 – Emissions Factor (CO2e/kWh) x yearly electricity consumption (kWh) = Yearly Driving Emissions (kg CO2e/year).
The emissions factor used (0.63) is an average of all Australian states derived from the Clean Energy Regulator EERS (Emissions & Energy Reporting System) release 2021–22.
This calculator uses the % of electricity derived from grid and road charging only to calculate yearly driving emissions.
Emissions Factor (CO2e/km) x (Electricity Total kWh/year x (% Grid Charging + % Road Charging)) = Yearly Driving Emissions (kg CO2e/year).
ICE Vehicle
As specified in ISO (International Organization for Standardization) 14064 – motor gasoline/petrol emissions factor = 2.33 kg CO2 per litre.
Download The Calculator
Get your free EV Vs ICE TOC calculator here. No login or email address is required. Let me know your results, and any other feedback is very welcome.
Footnotes
- Fringe benefits tax (FBT) may be due in some instances by employers providing vehicles for employees. Since 1 July 2022, employers do not pay FBT on eligible electric cars and associated car expenses. FBT is still due on ICE vehicles where applicable.

- There’s a new kid on the block which will be cheaper than the MG ZS EV in this worked example. Available in the second half of 2023 will be the MG4 EV priced at around $42,000. This will change the equation and tip the scales towards an EV being more economical than an ICE vehicle over the life cycle of the vehicle.
Original Source: https://www.solarquotes.com.au/blog/ev-vs-ice-excel/
Related Posts:
 How Josh Pays Just $612 Per Year For Electricity,…
 “Sun Tax” Financial Impact A Nothing-Burger
 Helping Australia’s EV Revolution Charge Ahead
 VIC Government Signals Scrapping Of EV Registration Discount
 Majority Of SA Drivers Considering An Electric Vehicle
 Electric Vehicle Strategy Update Highlights EV…
 South Australia’s EV Tax Officially Ditched
 Recharging Australia With Strong Fuel Efficiency Standards


