
How Josh Pays Just $612 Per Year For Electricity, Gas & Petrol


In 2023, Josh Mylne and his family reached a milestone many aspire to: an all-electric lifestyle. Their energy bills, once soaring over $5,500, have been slashed to just $612 for the entire year, thats for both home and transport. Josh now spends only 11% of his pre-electrification yearly bills, and a mere 10% compared to the average West Australian household’s energy + fuel costs.
Recapping Josh’s Journey Pre 2023
Like many of us, Josh is a little addicted to Excel spreadsheets. Although economics wasn’t the primary motivator for electrification, the spreadsheets he created gave him confidence that his decisions were sound.
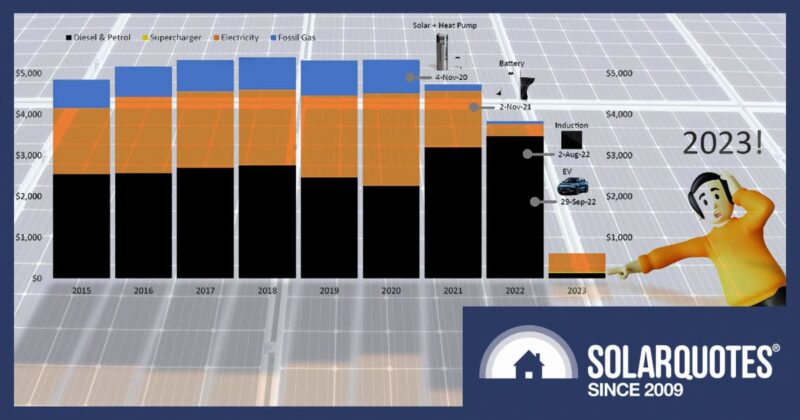
When I shared his story in early 2023, Josh had estimated that the combined rooftop solar plus battery investment would pay back in 6.4 years. We didn’t include the EV because he only had about three months of data. So now, a year later, we can add transport energy costs into the mix. First, here’s a timeline of Josh’s journey so far:
- November 2020: He installed 6.56 kW of solar panels. The system includes 19 x 350W Qcell solar panels and a Huawei1 SUN2000 single-phase 5kW hybrid inverter.
- November 2020: He replaced the gas hot water system with an iStore 270L heat pump.
- November 2021: He installed 10 kW of Huawei Luna solar batteries in the garage.
- November 2021: Solar upgrade – 7 x 350W solar panels were added to the system, bringing it to 9.1kW of solar capacity.
- July 2022: The family ditched gas altogether, replacing the gas cooktop with an induction one.
- September 2022: They purchased a new BYD Atto 3 electric vehicle that replaced their aging 2011 diesel Holden Captiva.
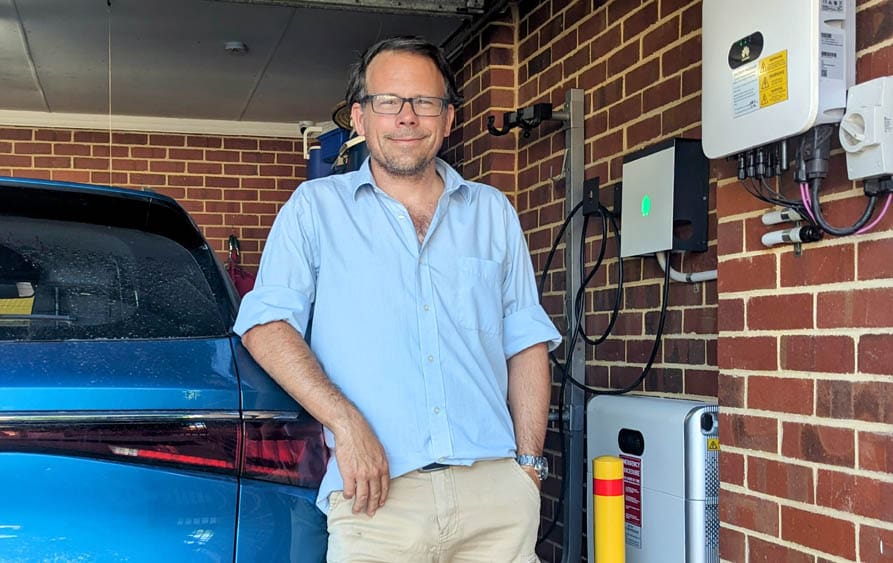
Josh with some of his electrical gadgets – EV, inverter, battery, and charger.
How’s The Payback Estimate Going?
So, how is Josh tracking along with his payback estimate for the solar/battery system?
Good question! In the first estimate, we left out transport fuel costs. Since owning the EV, breaking down costs has become tricky because he now spreads electricity between home and EV usage.
To find Josh’s total household energy use, we could do one of three things (or all of them):
- Leave the first solar/battery estimate alone and do a total cost of ownership analysis for his EV, comparing it to “keeping his old diesel clunker”. The first solar/battery estimate was so impressive that (in my opinion) it’s a foregone conclusion that the system will pay for itself within it’s lifetime.
- Update the first solar/battery estimate with the last 12 month’s data, and also do the total cost of ownership analysis for the EV as above. It wouldn’t be as accurate because we would double-count electricity for the EV – once in the solar/battery payback analysis and once in the EV vs diesel vehicle comparison.
- Update the first solar/battery estimate with the last 12 month’s data plus fuel costs. We would also have to add fuel costs (diesel) to the initial “post solar/battery annual bills” and add the EV purchase price to “upfront costs”. It also could be inaccurate because, unlike the separate EV total cost of ownership comparison, it doesn’t include depreciation and other transport costs.
There may be other ways to do this, but I only have one lifetime, so I’m going with #1.
EV Vs ICE Vehicle Total Cost Of Ownership Calculator
I, too, have been obsessed with spreadsheets. Here’s one I prepared earlier just for this special occasion. I asked Josh to download it and compare the total cost of ownership for “buying his EV vs keeping his old Holden Captiva”. Josh loves spreadsheets, so he obliged.
With Josh’s data, the calculator estimated that his EV would be a better investment within six years than keeping his old car. Emissions, including embodied manufacturing, would also pale compared to diesel vehicles.
Not only would he be in a better financial position, but he would have enjoyed the comforts and benefits of a new vehicle rather than keeping his old wreck going with mounting maintenance bills.
Download the calculator and try it yourself.
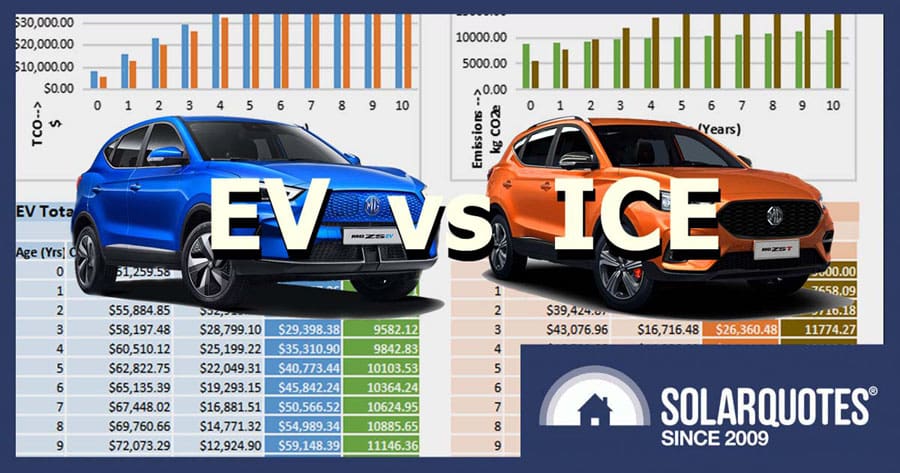
EV vs ICE Vehicle Total Cost of Ownership Spreadsheet. Try it yourself!
Josh’s Total Energy Costs In 2023
Remember what Josh told us earlier about his total energy costs for 2023? Since going all-electric, he paid only $612 that year for home and transport energy costs. Sounds impressive. Let’s break it down. It’s straightforward because his only fuel now is electricity (almost).
- Gas = $0
- Petrol = $1372
- Electricity = $447
- Fast Charger = $28
- Total = $612
2023 was the first full year our house was all electric. In 2019 energy bills were heading over $5,500, but over a series of steps, by 2023 we paid just $612 for all energy needs. #ElectrifyEverything 🏡🚗🔌⚡️🔋🌞🌏💚
Details how we got there: https://t.co/2jvu994uyG pic.twitter.com/Q6lzbxm5fi— Joshua Mylne (@j_mylne) December 29, 2023
Mylne Household Vs The Average Aussie Household
Before researching this article, I thought that the Mylne household (Josh and his family), living in Perth suburbia, would have fit straight into the stereotype of the average Australian household. Not any more! Here’s a snapshot:
| Mylne Household | Average Household | |
|---|---|---|
| Household Size | 4 | 2.52 |
| Vehicles per Household | 1 | 2.05 |
| Yearly km per Vehicle | 13,000 | 12,100 |
| Yearly Fuel Bill | $137 | $3,2983 |
| Yearly Electricity Bill | $475 | $2,2004 |
| Yearly Gas Bill | $0 | $5155 |
| Total | $612 | $6,013 |
So, the average household in Perth spends around $6,000 each year on total energy, while the Mylne family only spends $600(ish). That’s a saving of $5,400 annually by going all-electric. Nice work!
But let’s be honest. It’s not a true reflection of savings because they had to buy an EV to get into this position in the first place. Get out your spreadsheets; it’s time for a new comparison!
The Dylnes Next Door (Hypothetical Example)
Around the same time that the Mylne family bought their EV, the Dylne family next door, by coincidence, also needed a new car. They decided to buy a comparable-sized petrol vehicle. Lucky them. Petrol vehicles only cost around 70% of the price of EVs at the time, so they saved about $15,000! They also didn’t need none of that new fancy solar and battery waste of money. Another $17,000 saved!
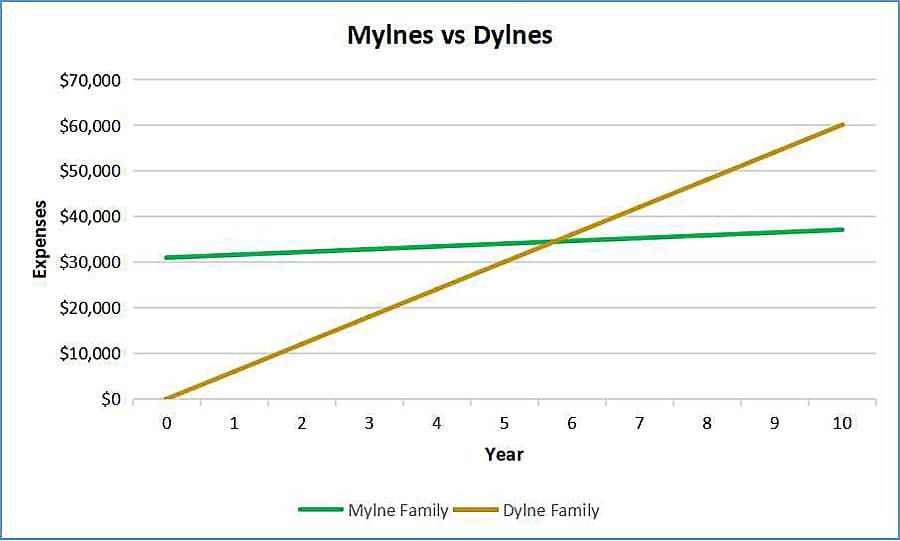
The average age of a registered passenger vehicle in Australia is 10.6 years. Let’s say ten years. When the Mylne family is ready for a new car, they would have saved over $54,000. Meanwhile, the Dylnes next door would have saved a grand total of zero. But the Mylnes started behind to the tune of -$31,000. Let’s see how they went.
The Mylnes fork out $31,000 at year 0 (start of year 1), comprised of a $15,000 premium for their EV compared to a petrol one, plus $17,000 for solar and battery. They now pay $612 per year in energy costs. The Dylnes got a bogun bargain priced petrol car and didn’t pay outrageous prices for woke solar. Like many average Aussies, they pay $6013 each year for energy (petrol, gas, and electricity.)
| Year | Mylne Family | Dylne Family |
|---|---|---|
| 0 | $31,000 | $0 |
| 1 | $31,612 | $6,013 |
| 2 | $32,224 | $12,026 |
| 3 | $32,836 | $18,039 |
| 4 | $33,448 | $24,052 |
| 5 | $34,060 | $30,065 |
| 6 | $34,672 | $36,078 |
| 7 | $35,284 | $42,091 |
| 8 | $35,896 | $48,104 |
| 9 | $36,508 | $54,117 |
| 10 | $37,120 | $60,130 |
Are You A Mylne Or A Dylne?
As you can see, before year six is out, these two families will be neck and neck with expenses. By the ten-year mark, the typical age of a registered passenger car, the Mylne family have an extra $23,000 to go towards their next electric vehicle, while the Dylnes have a big fat zero. This breakdown is a simplistic example, and we haven’t considered the many other variables, but you can see the trend.
I’ll let Josh have the last word.
“Nothing can compete with the energy supply line for EVs! The power goes straight from my roof into my EV. I only wish my inverter was 10 kW instead of 5 kW, so I could really punch surplus solar into the EV on those sunny days at the full 7 kW.”
Josh updates his own blog regularly as he continues his quest to eliminate fossil fuels. Please visit his site and give him a reminder to get rid of those stinky mopeds sitting in the back of his shed.
Footnotes
- Huawei inverters are now sold as iStore in Australia ↩
- Josh hasn’t quite kicked his habit yet. He managed to get rid of his petrol leaf blower and brush cutter last year, but still has a couple of petrol mopeds in the garage. ↩
- Although sales of EVs in Australia are booming, the percentage of registered EVs is still less than 0.1% (130,000 registered EVs vs 15.07 million registered passenger vehicles). Therefore, EV families do not affect average fuel costs. The average Perth household spends $1,609 yearly on fuel per vehicle. Multiply that by the average number of household vehicles (2.05 x $1,609 = $3,298). ↩
- This statistic is for WA only (from energy retailer Synergy.) ↩
- The average yearly Australian gas bill is $780. However, only approximately 66% of WA households are connected ($780 x 66% = $515). ↩
Original Source: https://www.solarquotes.com.au/blog/josh-612-per-year-bills/
Related Posts:
 Home Solar + Battery + Electrification Payback Under…
- Australian Solar Prices: December 2022 Update
- More Solar Powering WA Water Corporation
- Australian Solar Prices: January 2023 Update
- Australian Households Embracing Home Batteries
- New Year, New Renewable Energy For Bathurst Council
- Can You Add Solar Panels to an Existing System?
- VIC Community Groups To Slash Bills With Solar And Batteries


