

“Sun Tax” Financial Impact A Nothing-Burger


There has been much gnashing of teeth and rending of garments over the so-called “Sun Tax”. But initial analysis from SolarQuotes based on real-world data indicates the impact will cost less than a carton of beer a year for most solar power system owners affected by it.
While two-way pricing on solar exports introduced by some electricity distributors has been incorrectly named a “sun tax”, the label has stuck. Two-way pricing takes a carrot and stick approach – charges (basically a feed-in tariff reduction) between 10am and 3pm to encourage more solar energy self-consumption, and rewards (a feed-in tariff boost) for exporting to the grid when it needs it most late in the afternoons through to late evenings.
Sun tax hype is pushing some solar system owners to consider a home battery.
“There are lots of good reasons to justify buying a home battery in 2024,” says SolarQuotes founder Finn Peacock. “Avoiding the ‘Sun Tax’ is not one of them.”
SQ Sun Tax Calculator – Initial Analysis
SolarQuotes recently launched an easy-to-use Sun Tax calculator; explained in detail here. Since that time, it’s had enough use for us to start getting an idea of how much two-way tariffs will impact system owners if they are subjected to it. Currently it’s just based on Ausgrid’s (NSW) two-way pricing structure, which is:
- 10am to 3pm = Feed-in Tariff (FiT) reduced by 1.2c / kWh
- 4pm to 9pm = FiT increased by 2.3c / kWh
… and assumes an electricity retailer passes these rates on in full.
Average cost impact over a year – peanuts
Around 58% of people who used the calculator live in NSW. But here’s how the numbers look (charges minus rewards) if Ausgrid’s two-way pricing applied across Australia; based on 122 records:
- Maximum Benefit: $18.88
- Maximum Cost: $94.92
- Mean Cost $28.96
- Median Cost: $26.19
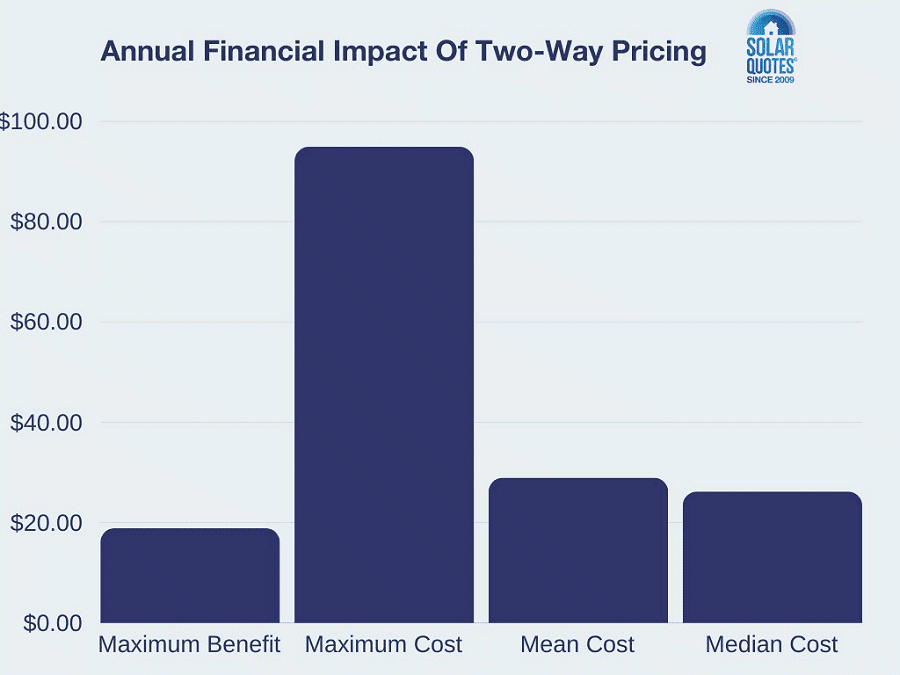
So, the average cost impact on a bill – or total feed-in tariff reduction (however you want to look at it) – was $28.96 over a year, or around 8c a day.
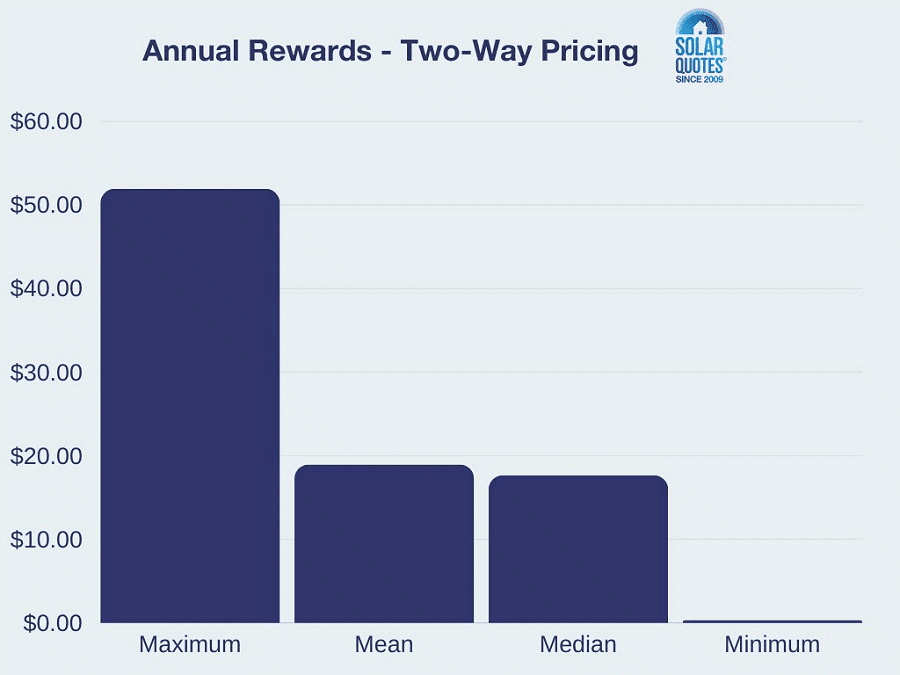
Just looking at the rewards aspect, again over a year:
- Maximum: $51.93
- Mean: $18.96
- Median: $17.66
- Minimum: $0.34
The average system capacity across the dataset was a bit over 9.2kW. The user with the maximum cost ($94.92) piqued our interest, so we dug deeper. It was a 15kW system owner in South Australia on an 8.5c feed-in tariff. Some further details on that instance:
- Feed in tariff credit over 12 months: $1,605.55
- After two-way pricing: $1,510.63
- Total Charges: $133.99
- Total Rewards: $39.06
- Total Annual Feed-In Tariff Impact: -$94.92
Even in this outlier instance, if the owner was to buy a battery purely out of a misplaced “sun tax” fear, payback (for example) on a Tesla Powerwall would take around 112 years based solely on the current charge component. Powerwall’s a great battery, but the chances of one lasting that long are somewhere between Buckley’s and none.
Of course, there are other benefits from batteries, particularly in this age of less than stellar feed-in tariffs. But this just illustrates that two-way pricing shouldn’t be the primary motivator for acquiring one. For system owners who are considering a solar battery, here’s a list of other common mistakes to avoid.
Crunching Numbers Is Crucial
The results above are based on a small data set – we encourage Australia solar owners to give the Sun Tax calculator a whirl so we (and you) can gain a better understanding of two-way tariff potential impacts.
And before you take the plunge on a battery purchase, try the SQ “add battery” calculator to determine how much home energy storage might save you and the estimated simple payback period.
Original Source: https://www.solarquotes.com.au/blog/sun-tax-analysis-mb3001/
Related Posts:
 Calculate How Much A “Sun Tax” Might Affect You
 Debunking The Screams Of “Sun Tax!”
 EnergyAustralia Takes Its Scissors To Solar Feed-In…
 BS Called On Queensland “Sun Tax” Scare
 Ausgrid’s Two-Way Pricing For Solar Exports Looms
 Mandatory “Sun Tax” Not In Powercor’s Plans
 Western Australia’s Solar Feed-In Tariff Dropping Again
 2024/25 NSW Solar Feed-In Tariff Guidance Published


