
2021 Solar Panel Torture Testing: ET, LONGI, & SunPower Do Well

At the moment we’re locked down in Adelaide. Because I’m no longer able to smuggle badgers across the border in my beard as I’d planned, I’m catching up on stuff I should have written about weeks or months ago.
One of these things is the PVEL 2021 Module Reliability Scorecard report that came out in May. While I’ve been tardy bringing it to your attention, it’s far too interesting to let slip by.
PV Evolution Labs — PVEL for short — tests solar panels to determine how tough they are. Those that do well are likely to survive decades without failing. Every year they publish a report in which they reveal the top performers, while not giving any information on which panels performed poorly.
While they don’t tell which panels failed, knowing which manufacturers make panels that are tough enough to pass is still useful information. In this article, I’ll give a rundown of the tests they perform and tell you which manufacturers had at least one panel model in the “Top Performer” category. These are panels that only suffered 2% or less deterioration in output from torture tests simulating decades of exposure to the elements.
I’ll provide a table at the end showing which manufacturers had at least one model of panel pass the torture testing. But this table isn’t as useful as it could be, because we don’t know whether or not panels that didn’t get a good result were tested at all. It only provides evidence solar panels classed as Top Performers are good quality and not evidence that panels that aren’t in that category are bad. In other words, being a Top Performer is good, but not being one doesn’t mean much.
Before I describe the different tests and the results, I’ll provide some interesting information from the start of the report.
Interesting Tidbits
The report introduction gives information on…
- The effects of different encapsulant formulations on the output of 35-year-old solar panels in Switzerland.
- The negative effects of high temperature on solar panels in India.
35-Year-Old Encapsulant: A solar panel is a solar cell sandwich. The slices of bread are the glass cover and plastic backsheet, while the solar cells are the filling. It’s all held together by glue that covers, or encapsulates, the solar cells. This is why it’s called the encapsulant.
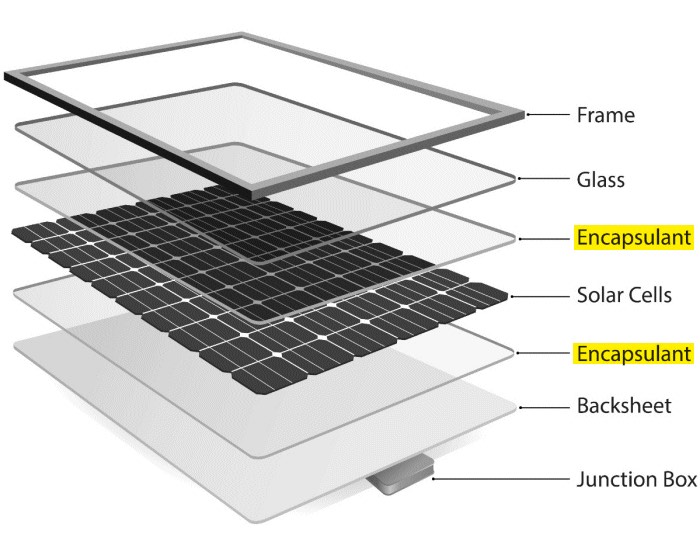
If its quality isn’t high, over time the encapsulant will deteriorate and darken, reducing output. In a worst-case situation, crap encapsulant can cause a panel to peel apart.
The benefit of high-quality encapsulant has been shown by Swiss solar panels that have been in use for 35 years. That’s longer than the subjective length of my first marriage. Three different formulations were used and the current panel performance is:
- Best encapsulant: 95.1%
- Not so good encapsulant: 80.9%
- Worst encapsulant: 73.9%
This graphic from the report shows the very visible difference:
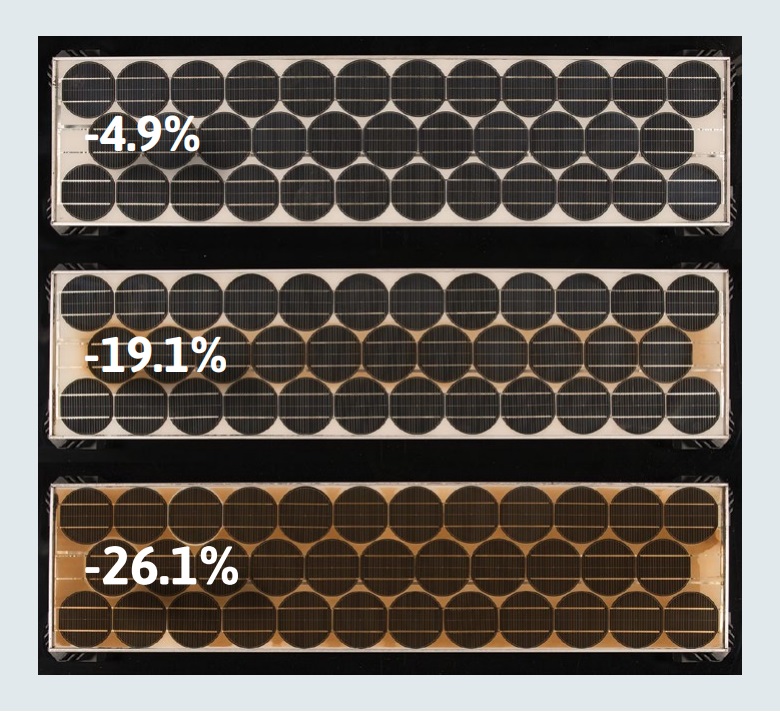
The 4.9% decrease in output over 35 years for the best panel is impressively low. That’s little more than 0.1% per year.
Hot Indian Panels: A study of 36 solar farms in India1 showed — on average — those built in the last five years were deteriorating faster than older projects. The average annual deterioration was 1.47% per year, which is more than twice the 0.7% most solar panel performance warranties allow. The deterioration was worse in hot regions and less severe in cold, mountainous areas. Obviously, this isn’t good news for a place like Australia that has a lot more hot than cold. On the bright side, I’d say this lousy deterioration level is most likely due to project managers taking a gamble on low-cost panels rather than good solar panel manufacturers going backwards on quality.
Test Methodology
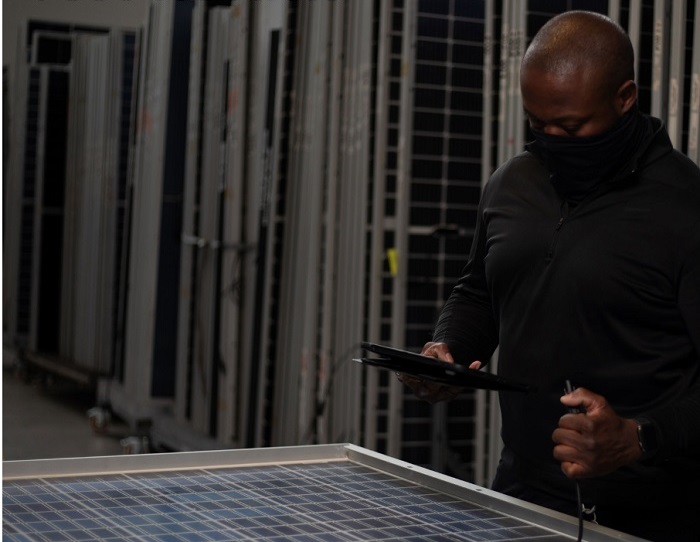
PVEL puts in a lot of effort to ensure their tests are accurate. For one thing, you can’t just send them panels for testing. It would be far too easy to game the results by sending ones in great shape. But PVEL doesn’t just randomly buy panels to test. Their methodology goes way beyond that.
What they will do is send auditors to solar panel producing factories, and their job involves:
- Inspecting the factory. (Presumably to look for gremlins.)
- Photographing materials as they are unpacked to establish they match what is on the Bill Of Materials or BOM — the list of materials the solar panels are supposed to be made from.
- Making sure those materials are the ones actually used.
- Taking samples and checking recipes for solder and encapsulant. (Yes, they are recipes, since making glue and solder is like cooking.)
- Select panels for testing, seal them up, and send them direct to PVEL.
As you can see, the process is pretty involved. It’s also not cheap. The expense is one reason why we can’t know if a panel that doesn’t appear among the Top Performers failed a test. A manufacturer may simply have not wanted to shell out for testing.
The 5 Tests
PVEL has five physical tests they subject panels to:
- Thermal Cycling — Checks resistance to changes in temperature.
- Damp Heat — Ability to survive hot, humid, tropical conditions.
- Mechanical Stress Sequence — Resistance to deterioration from pressure applied by wind.
- Potential-Induced Degradation (PID) — A type of deterioration more common in hot and humid areas.
- LID + LETID — Deterioration suffered by P type panels + deterioration suffered by PERC panels.
To be considered a Top Performer a solar panel must survive a test while suffering 2% or less deterioration in output.
At first, I thought his workplace must be really cold to require a turtleneck like that, but then I remembered that places besides South Australia have suffered pandemic related problems.
The names of panels that fail aren’t given, but graphs are provided showing how poorly these “no-names” did.
Thermal Cycling Results
An operating solar panel heats up when the sun shines on it and cools down when the light is blocked by a cloud or a planet. If the planet blocking the sun is earth, then it results in a condition known as “night”. But on rare occasions the mini-planet we call the moon gets in the way.
[embedded content]
The difference in temperature between day and night and cloudy and clear causes panel components to expand and contract. This occurs at different rates in different materials and puts the joins between them under strain. Over time this can damage the interface and cause a panel’s performance to slowly decline.
To simulate decades of natural thermal cycling, PVEL shoves panels in a combination freezer/oven test chamber where they cool the panels to -40°C and then heat them to 85°C. A temperature differential of 125 degrees. They do this 600 times. Manufacturers whose solar panels suffered less than 2% deterioration in output were declared Top Performers and I’ve listed them below:
- Adani/Mundra
- Astronergy
- Boviet
- ET Solar
- GCL
- Hyundai
- Jinko
- Longi
- SunPower Maxeon
- Phono Solar
- Q Cells
- REC Group
- Seraphim
- Silfab
A number of manufacturers had multiple series of panels tested and both Longi and Q CELLS had five different panel models pass the test and get Top Performer status. This is a good sign they can produce a range of durable solar panels. But, again, we don’t know how many different panel models a manufacturer had tested, so we can’t really conclude anything based on the number of panel models that pass a test.
A good result on this test is important in central Australia where differences between day and night temperatures are often extreme. Rooftop solar panels tend to get a little hotter than ones in solar farms due to lower air circulation, so this test could be especially important for these panels. But the majority of Australian roofs are close to the coast where temperature extremes aren’t too bad, while solar farms tend to be further inland.
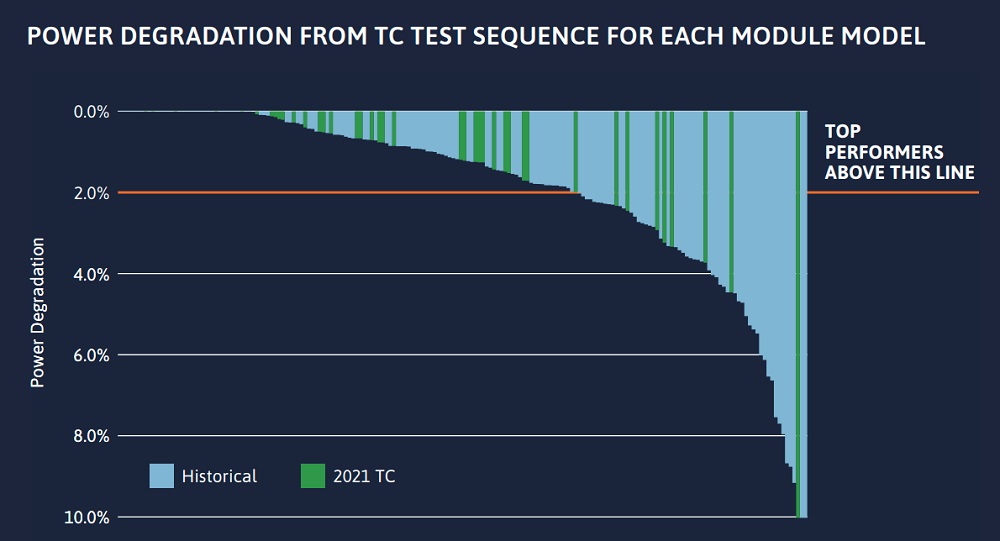
As the graph above shows, most panels tested this year suffered less than 2% deterioration, but there was one stinker that had its output decline by at least 10% and it was among the worst ever tested.
Damp Heat Test Results
Heat and humidity are bad for electronics of all sorts and solar panels are no exception. Tropical conditions in the far north can be very hard on them. This is one reason many Darwin installations use LG Solar panels, as they tend to be durable2. If a panel is very poorly made then heat and humidity won’t just degrade it, it will cause the panel to completely fall apart.
The Damp Heat Test consists of shoving panels into a big slow cooker that keeps them at 85 degrees and 85% humidity for 2 sessions of 1,000 hours each. That totals to just short of 12 weeks in a sauna for solar panels.
Batman is so strict he doesn’t allow anything to interfere with testing procedures.
If a panel performs poorly on this test it’s an indication it’s unable to keep water out long term and is not suitable for wet and humid climates.
The Top Performers are listed below, but this test cheats a bit. Only 30% of the top performers suffered less than 2% deterioration after the sauna treatment. The other 70% only recovered enough capacity to become Top Performers after some of the deterioration was reversed by sending a high voltage current through the panels for 48 hours. While this treatment — called BO Stabilization3 — may be done on panels in solar farms in the future, it’s not likely to be done to those on rooftops.
Manufacturers with solar panels that were genuine Top Performers before receiving the BO treatment were:
- Boviet
- ET Solar
- HT-SAAE
- JA Solar
- SunPower Maxeon
- Talesun
Manufacturers with panels that only received Top Performer status after BO stabilization treatment were:
- Adani/Mundra
- Boviet
- GCL
- Hyundai
- JA Solar
- LG Electronics
- Longi
- Q Cells
- REC Group
- Seraphim
- Silfab
- Talesun
- VSUN
Some manufacturers are on both lists because they had multiple panel models tested with some doing better than others.
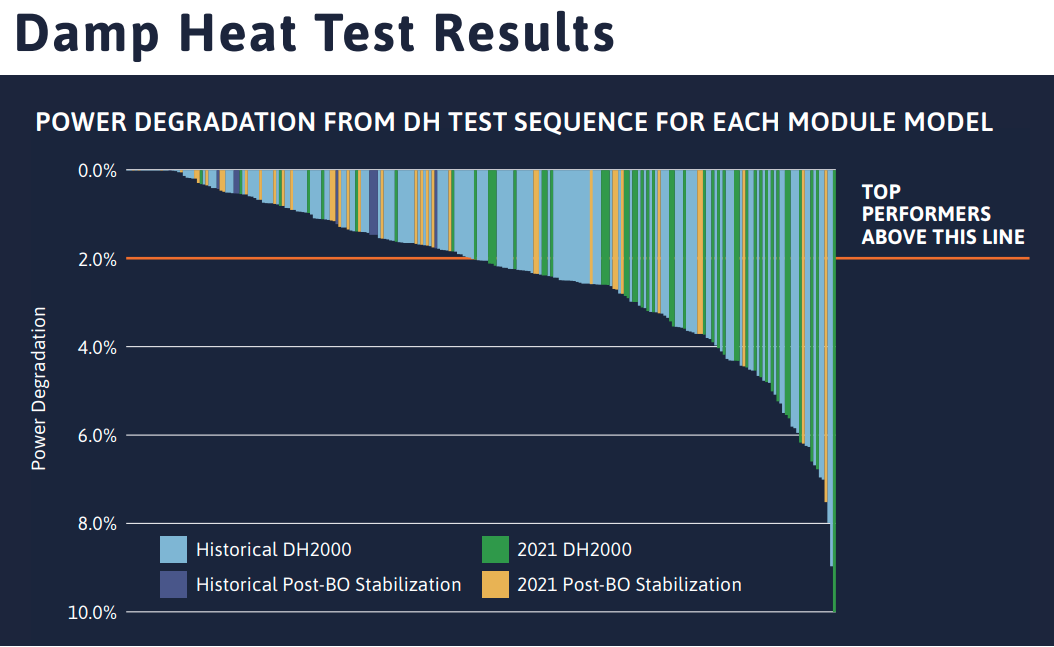
Looking at the graph above, my guess is none of the panels that become Top Performers after the BO stabilization process suffered more than 4% deterioration initially.
Mechanical Stress Test Results
Wind places pressure on solar panels. It can push down from above and — like the wind blowing your umbrella inside out or cheekily removing the roof from your home during a cyclone — it can also push upwards from below. This pressure can cause panels to flex when the wind blows and the strain can cause gradual deterioration over time. The Mechanical Stress Test determines which panels are able to resist this.
The test involves subjecting panels to one hour of downward force and one hour of upward force of 2,400 pascals. For a typical rooftop solar panel that’s equal to evenly distributing around 427 kg of weight on it. That’s a lot. My brother and I together wouldn’t come to that much. (This is because my brother is just a skinny little guy.) This procedure is carried out three times.
Then the panels are subject to 1,000 cycles of alternating positive and negative pressure of 1,000 pascals. This is equal to 178 kg for a typical solar panel. (So just my brother, then.) If this process puts tiny cracks in the solar cells they may still be tightly jammed together so losses from the cracking will be minimal. To tease these cracks apart, the panel is then given 50 thermal cycles, as in the thermal cycling test, and 10 humidity freeze cycles where they are kept in warm humid conditions and then frozen.
In general, panels with half-cut cells do better on this test than those with full-size cells. On one hand, this isn’t too surprising because smaller cells mean each should be under less strain when flexed. On the other hand, half-cut cells also have twice as many connections that could suffer damage from flexing, so it could have gone the other way.
Top Performers were…
- Boviet
- ET Solar
- First Solar
- Jinko
- LG Solar
- Longi
- SunPower Maxeon
- Phono Solar
- Q Cells
- Seraphim
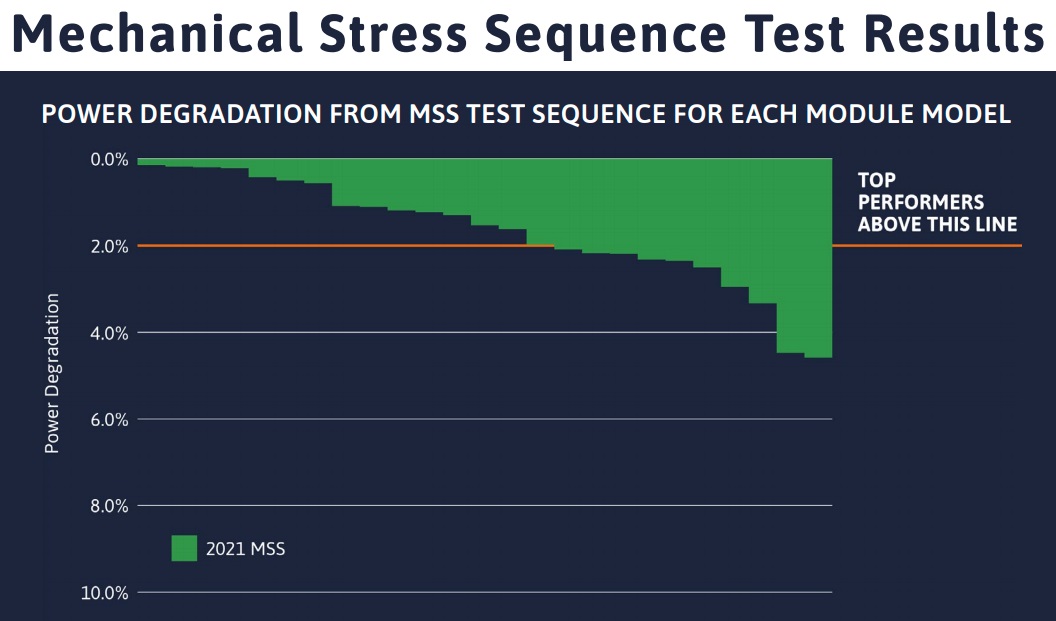
As the graph above shows, all 25 tested solar panels degraded less than 5%, which is a good sign most manufacturers are getting this reasonably right.
Potential Induced Degradation (PID) Test Results
My doctor tells me to avoid sodium because it’s bad for my health:
[embedded content]
It can also be bad for solar cells. If sodium ions from a panel’s glass cover get into the solar cells below, it can cause a form of degradation known as Potential Induced Degradation or PID for short. The sodium ions can be carried to the cells by leakage currents, which are unwanted stray electrical currents in the panel.
“Curses, Robin! I can already feel sodium ions from this glass landing on my head!”
This type of degradation is most likely to occur in hot humid locations, like Townsville or Darwin, so for this test solar panels are shoved in the sauna chamber used for the Damp Heat Test and exposed to 85 degrees at 85% humidity for two periods of 96 hours each. While this is much shorter than the period for the Damp Heat Test, at the same time the panels also have the maximum voltage they are rated to handle passed through them. Either 1,000 or 1,500 volts.
The following manufacturers had at least one panel model come out as a Top Performer in this test with deterioration of 2% or less:
- Adani/Mundra
- Boviet
- DMEGC
- ET Solar
- First Solar
- HHDC
- JA Solar
- Jinko
- Jolywood
- LG Electronics
- Longi
- SunPower Maxeon
- Phono Solar
- Q Cells
- REC
- Risen Energy
- Silfab
- Talesun
- Vikram
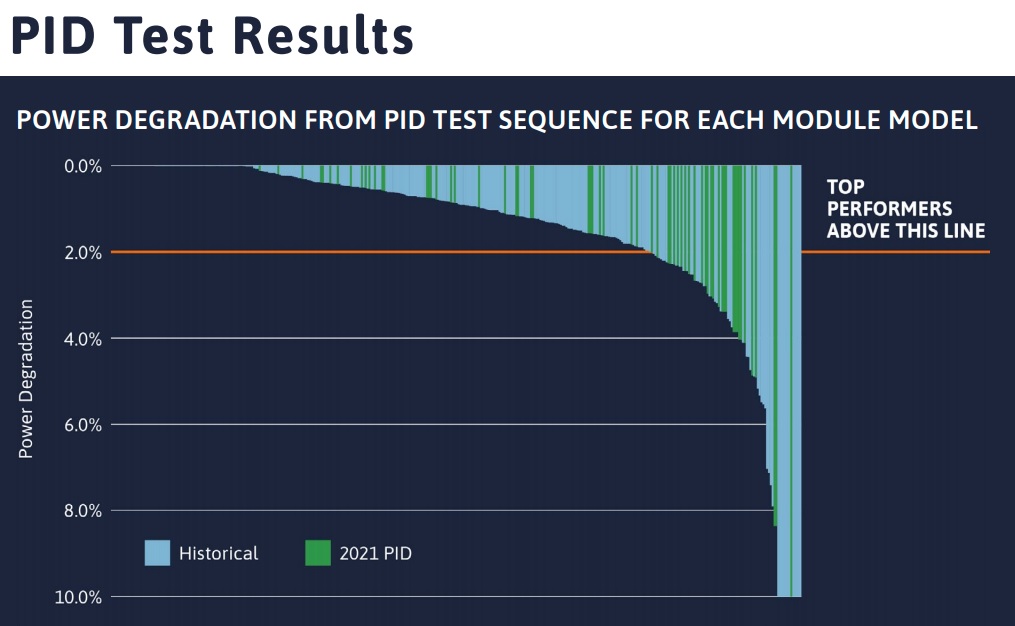
Unfortunately, as the above graph shows, there were some lousy panels on this test with three suffering more than 8% deterioration and one suffering at least 10%. This means some people who choose solar panels poorly will have PID problems for a while to come.
LID + LeTID Test Results
LID stands for Light Induced Degradation. It’s a type of deterioration P type solar cells suffer from and the majority of solar panels are P type. It typically reduces solar panels output by around 3%4 during their first day or two in the sun and then stops.
LeTID stands for Light and elevated Temperature Induced Degradation. This is a problem that only PERC panels suffer from, but most panels sold these days are PERC. As all PERC are P type, they will suffer from LID and may also suffer from significant amounts of LeTID.
The LID + LeTID Test involves exposing the panels to sunlight until they reach the maximum amount of LID they will suffer from. They are then placed in a chamber and used to generate electricity under the equivalent of full sunlight for 486 hours. That’s just under three weeks. The panels aren’t exposed to more than full sunlight to speed things up because this might cause problems that aren’t seen in normal use.
The Top Performers in this test with less than 2% deterioration were:
- Adani/Mundra
- Astronergy
- Boviet
- ET Solar
- HHDC
- HT-SAAE
- Hyundai
- JA Solar
- Jinko
- Jolywood
- LG Electronics
- Longi
- SunPower Maxeon
- Phono Solar
- Q Cells
- REC
- Risen
- Talesun
- Trina
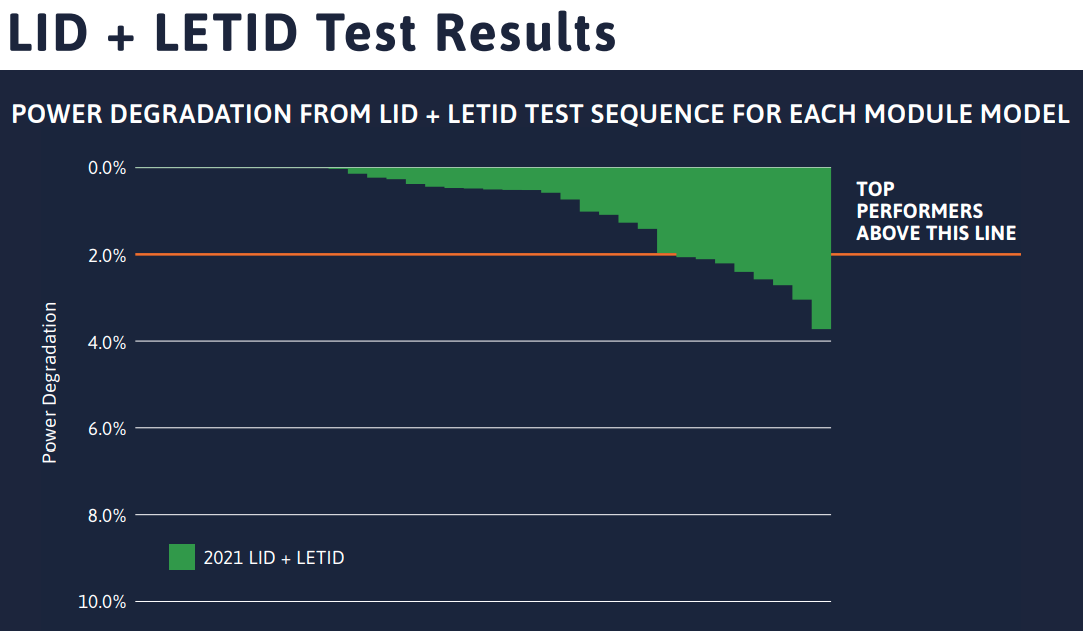
As you can see in the graph above, all solar panels tested suffered less than 4% degradation and all but one suffered 3% or less. This suggests the industry has been mostly successful at minimizing losses from LeTID and, as I mentioned in the past, it’s not likely to be a major cause of panel deterioration.

Top Performer Summary
As promised, I have put all the Top Performer results into a table.
But before I show it to you — just in case some naughty person skipped to the end without reading every word — I’ll point out once again that getting a Top Performer result means a manufacturer’s panel did well in a test and suffered 2% deterioration or less in output, but we can’t conclude anything about solar panels that didn’t get a Top Performer result.
We have no way of knowing if non-Top Performers received that test and failed or weren’t tested at all. That’s why there are question marks if a manufacturer have a Top Performer result in a test. We simply don’t know if their panels are able to pass that test or not.
Now I’ve gotten that out of the way, here is the summary table:
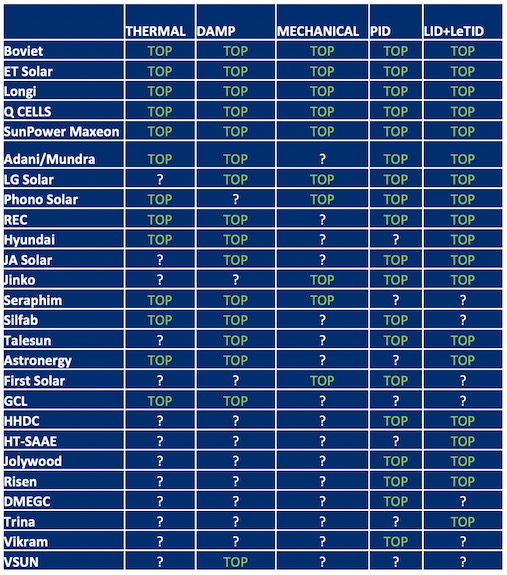
If a manufacturer has the word TOP in a test category it means they had at least one panel get a Top Performer result in that test.
The five manufacturers that swept the board with a Top Performer result in every category were…
- Boviet
- ET Solar
- Longi
- Q CELLS
- SunPower Maxeon.
This is good evidence panels made by these manufactures know how to make long-lasting panels that suffer little deterioration in output. However, all we can be certain of is they are able to make solar panels that can pass these tests. Not all their panel models may do so.
At the bottom of the table are Trina, Vikram, and VSUN with just one Top Performer result each. However, we can’t say they’re worse than the manufacturers at the top of the table. All we can say is the report doesn’t provide as much evidence they are good.
Best Individual Solar Panels
While five manufacturers had at least one of their panels pass all three tests, only three — ET Solar, LONGI, and SunPower Maxeon — had panels pass all five tests. These champion solar panels took all the punishment that PVEL was able to dish out with only minimal deterioration:
The two ET panels are bifacial. This means they’re made to make use of light falling on the front and the back. This makes them a poor choice for a normal roof. But the LONGI and SunPower Maxeon panels are monofacial and only made to use light from one side, making them suitable for roofs provided you don’t install them upside down. The LONGI panel is available in Australia while the SunPower Maxeon Australian site says the Maxeon 5 panel is available here as both a standard solar panel and an AC panel with a built-in Enphase microinverter.
This makes for two panels — including one that can come with or without a microinverter — suitable for rooftops and easily available in Australia. But there is also a runner up:
- Q CELLS Q.PEAK DUO L-G5.2
This Q CELLS panel initially failed the Damp Heat Test, but recovered enough after being given BO stabilization treatment to be gain Top Performer status. Because the BO stabilization process does not work miracles, I suspect its deterioration before the treatment was not much more than 2%. For this reason, I have no trouble calling the panel an almost champion.
Close Champions
In addition to the Champion and Almost Champion panel, there were two solar panel series that received Top Performer Results in four of the five tests. I’ll call these Close Champions and they were:
- Phono Solar Twin Plus (PSxxxM4GFH-24/TH)
- REC TP3M Black
There are also four runner up Close Champions that were Top Performers in four tests, but in the Damp Heat Test only became a Top Performer after receiving restorative BO stabilization treatment. The runner up Close Champions were:
Note the Close Champions and runners up may not all be available in Australia at the moment. If you are offered something with a similar name or number it may be a good solar panel, but it’s not likely to be the exact type of panel that received these PVEL test results.
That’s All
That’s all I have to say on the PVEL 2021 Module Reliability Scorecard. If you’re determined to know which solar panels were tested and failed, you can pay PVEL a lot of money for their full report with all the information. If you do that and want to let me know the details, I promise I won’t tell anyone who doesn’t promise not to tell anyone.
And that’s a promise.
Footnotes
- India is basically a badly lost, extra-large, upside-down Queensland with a much higher population density. ↩
- Hot, humid, and South Korea are words that definitely go together in their summer. ↩
- “BO” stands for “Boron Oxide”. ↩
- A panel with 20% efficiency that has its output reduced by 3% because of LID becomes 19.4% efficient. ↩
Original Source: https://www.solarquotes.com.au/blog/2021-pvel-panel-reliability/
Related Posts:
 Torture Testing Reveals Modern Solar Panels Are…
- 5 Misconceptions About the Effects of Weather on…
- 2021 PV Module Reliability Scorecard finds more…
- Finding the Right Warranty for Your Solar Installation
- Finding the Right Warranty for Your Commercial Solar…
- 2022 solar module scorecard finds product quality is…
- SimpliPhi completes UL 9540A fire safety tests
- The Top 3 Things to Look for in Solar Panels


