

Energy Related Carbon Emissions In 2021 “Highest In History”: IEA

Global energy-related carbon dioxide emissions hit their highest level ever last year according to a report from the International Energy Agency (IEA).
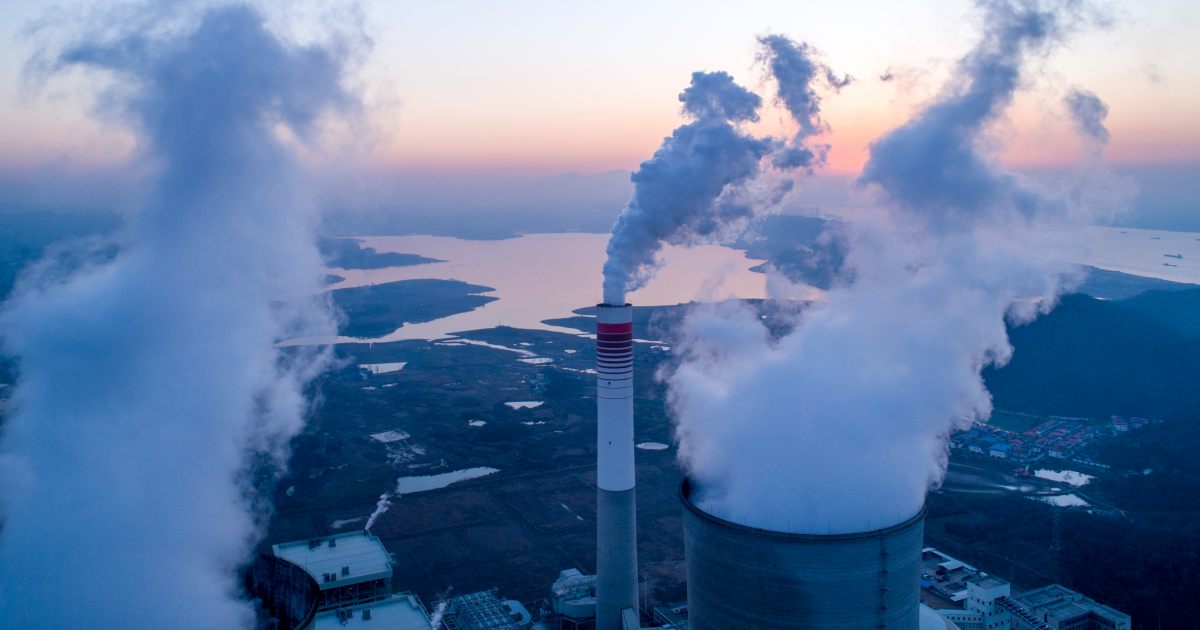
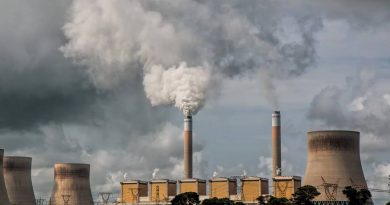
Emissions jumped by 6% (2 billion tonnes+) in 2021 to 36.3 billion tonnes due to a world economy rebound that relied heavily on coal power. The IEA says the increase was the “largest in history” in absolute terms.
While renewables-based electricity generation also saw its largest ever growth, adverse weather and energy market conditions including spikes in natural gas prices resulted in more coal being burned. The switch from gas-to-coal for electricity pushed up global CO2 emissions by well over 100 million tonnes.
“The numbers make clear that the global economic recovery from the Covid-19 crisis has not been the sustainable recovery that IEA Executive Director Fatih Birol called for during the early stages of the pandemic in 2020,” states the IEA. ” The world must now ensure that the global rebound in emissions in 2021 was a one-off – and that an accelerated energy transition contributes to global energy security and lower energy prices for consumers.”
In July last year, Mr. Birol lamented that while many governments were talking of the importance of building back better, i.e. greener, many were “yet to put their money where their mouth is“.
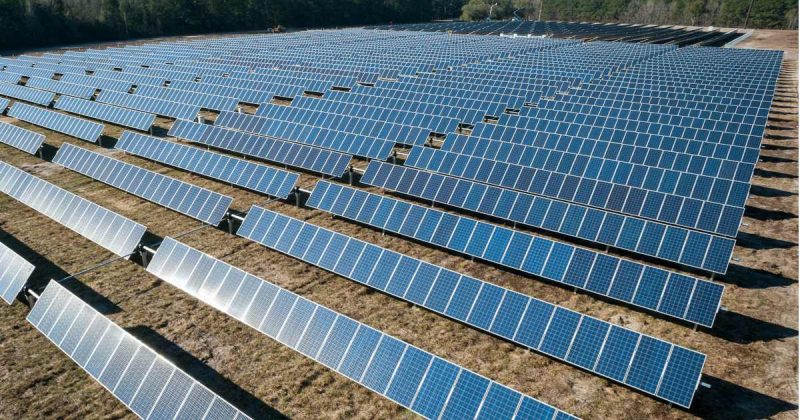
Renewables Generation An “All Time High”
The report notes electricity generation from renewables exceeded 8, 000 terawatt-hours (TWh) in 2021, up 500 TWh on 2020. Output from wind power increased by 270 TWh, while solar PV increased 170 TWh. However, hydro generation saw a 15 TWh decrease due to the impacts of drought, particularly in the USA and Brazil.
Nuclear power electricity output jumped by 100 TWh last year.
“Without increasing output from renewables and nuclear power, the rise in global CO2 emissions in 2021 would have been 220 Mt higher,” says the IEA.
Per Capita Emissions
CO2 emissions overall in advanced economies fell to an average 8.2 tonnes per capita last year; below the average of 8.4 tonnes in China. But many advanced economies rely heavily on China for manufacturing; effectively outsourcing their emissions to the world’s factory.
The report notes while per capita emissions fell in advanced economies, there were wide differences among them. For example, per capita emissions averaged 14 tonnes in the United States.
Australia wasn’t specifically mentioned, but we tend to rank pretty high up on emissions – in a bad way. I haven’t been able to find 2021 figures after a quick search, but according to the OECD, the 2018 Australian average was 22.4 tCO 2 e/ca. The Australian Government’s National Greenhouse Gas Inventory annual emissions data for 2020 indicates 505.5 million tonnes of emissions for that year, which works out to around 19.6 tonnes per capita. 2021 emissions haven’t been finalised, but by the end of the September quarter they had already hit 501.5 million tonnes – with three months left to go.
The IEA notes per capita emissions in other emerging market and developing economies worked out at 2.34 tonnes in 2021.
All the findings from the IEA’s Global Energy Review: CO2 Emissions in 2021 report can be viewed here.
Original Source: https://www.solarquotes.com.au/blog/energy-emissions-iea-mb2386/
Related Posts:
") Coal Power: The Comeback Kid For Now (But Not In Australia)
Coal Power: The Comeback Kid For Now (But Not In Australia)- IEA: Global Emissions Set To Surge To New High
- Clean Energy Investment Needs to Triple by 2030 to…
- Despite Pandemic, Renewables Notch Fastest Growth…
- Renewable Energy Became the Second-Most Prevalent…
- Developing Economies Pose Hurdle to Global Net-Zero…
- Renewables Reached Record Contribution of 10 Percent in 2021
- Fears Of EU Coal Power Rebound “Dead”
")


