

75% of Home Batteries Faulty In Long Term Battery Testing

Canberra Battery Test Centre just released Report #11 describing its third round of battery testing and the results.
I’ll give details below but, if you want a quick overview, I can tell you the new batteries didn’t do well. Only 2 of the 8 battery brands tested worked as they were supposed to. The rest had problems that ranged from temporary breakdowns to complete failure.
The 75% failure rate is awful. The testers sourced these batteries 2 years ago, but I know unreliable home batteries are still entering the market and using paying customers as unwitting beta testers. This is 6 years after Tesla launched the original Powerwall and 10 years after Sonnen started producing modern, on-grid, home batteries in Germany.
The results are disheartening for anyone looking to buy home battery storage, but you can improve the odds of getting one that works to better than 25% with the following two steps…
- Buy from a manufacturer with a track record of reliability, and…
- Use an installer who does quality work with excellent post-sales customer service.
This will help you avoid disaster and greatly improve the odds of having a hassle-free experience.
But using a home battery system from a large, well-known manufacturer is no guarantee it’ll be fault-free. The Canberra Battery Test Centre has experienced major problems with major brands. These include…
- BYD
- LG Chem
- Sonnen, and…
- Tesla
Most of these failed so hard they had to be replaced entirely. But you’re better off with a manufacturer that will replace your battery system if required rather than one that disappears when you need their support.
The fact most of the batteries tested had major issues only reinforces my previous conclusions from Battery Test Centre reports — it’s hard to make reliable home batteries. Several manufacturers are well on their way to getting it right, but we’ll need several manufacturers producing safe, reliable batteries in quantity before prices are driven down.
What The Hell Is The Canberra Battery Test Centre?
The Canberra Battery Test Centre tests batteries. If that surprised you, you’ve become far too accustomed to having your expectations subverted, and you’re the reason why the new Star Wars movies are terrible.

To obtain reliability information in a reasonable timeframe, they use accelerated testing; charging and discharging batteries up to three times a day. This allows up to 3 years of daily cycling to be simulated in a single year.
If you want to read the Test Centre’s reports, they’re all here. This article will focus and their 10th and 11th reports. The last article I wrote on this topic was 9 months ago, and the title wasn’t cheery…
Battery Test Centre 8th & 9th Reports: Many Home Batteries Still Unreliable
This article I wrote two years ago reveals the success rate of the first two rounds of testing were worse than 1 in 4…
This one from three and a half years ago has a Star Wars theme and, if you’re interested, describes the testing process…
The rest of this post has 5 parts:
- A quick description of the most successful and/or notable 4 batteries from Phase 1 — the 1st round of testing.
- The 3 most notable batteries from Phase 2 tests.
- Details on all 8 batteries taking part in this Phase 3 testing and how they performed.
- Information on battery capacity loss and round-trip efficiency.
- Steps to improve your odds of problem-free good home battery storage experience.
If you’re only interested in the new batteries, skip ahead to where it says “Phase 3 Testing”.
Phase 1 Testing
The 1st round of testing — Phase 1 — began in June 2016. Here’s a graphic showing the results:
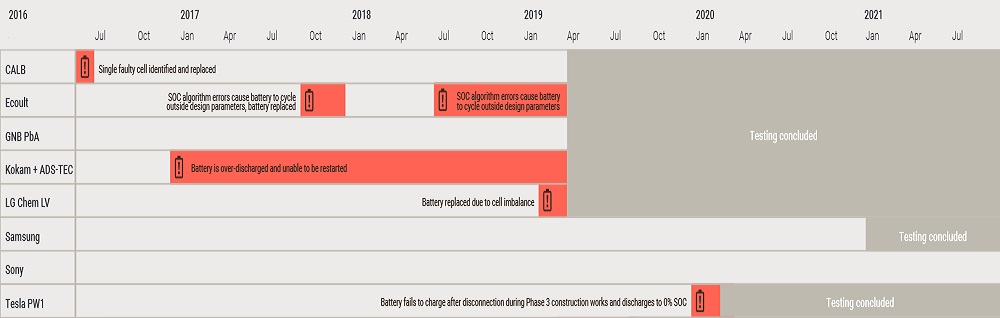
This graphic is from the Canberra Battery Test Centre, but I squished it to make it fit. If it looks wonky, that’s my fault.
Anything in red is bad, and even when there’s no red it doesn’t mean it’s good. Eight batteries entered the Phase 1 arena, but only 2 didn’t break down or fail somehow. One successful battery — the GNB PbA — is lead-acid, and that type won’t be used for future home battery storage. While lead-acid batteries are still used in some off-grid installations, there’s no hope of them becoming cost-effective for use on-grid. Of the 6 lithium batteries tested, only Sony did well, with Samsung in 2nd place.
Here are details on the 3 most notable batteries:
Sony Fortelion:
If failure stalks home batteries like a lion stalks its prey on the Serengeti then, when it comes to reliability, the Sony battery fought a lion and won. The Sony Fortelion is the only 1st phase battery system still operating after 6 years. Not only does it demonstrate reliable, long-lasting lithium batteries can be made, but we had them back in 2016. This battery is what new ones should aim to be. It has been undergoing accelerated testing for 6+ years and provided the equivalent of over 9 years of daily cycling:
- Cycles: ~3,330. Equivalent to 9.1 years of daily cycling.
- Remaining capacity: 81%
Unfortunately, it no longer appears to be available in Australia. Sad face.
Samsung:
The Samsung AIO (All In One) had the second-longest lifespan of the 1st phase batteries:
- Cycles: ~2,790. Equivalent to 7.6 years of daily cycling.
- Remaining capacity: 73%
The Samsung AIO did poorly compared to the Sony Fortelion with only 7.6 years of accelerated testing before failing, but that was still a good result for a Phase 1 home battery system.
LG Chem LV:
I am mentioning this battery to make the point that even though LG Chem is a giant organization with tremendous engineering talent, this has not been enough to prevent their batteries from suffering multiple problems. When a company like this has difficulty making reliable home batteries, it shows how difficult it is.
This battery, also called the LG Chem RESU 1, only operated for two and a half years before failing. LG Chem replaced it, but testing was not continued. Before failing, it managed the following :
- Cycles: ~1,183. Equivalent to 3.2 years of daily cycling.
- Remaining capacity: 78%
If its capacity loss continued linearly, it would have reached 60% of its original capacity in under 6 years of simulated daily cycling.
Phase 2 Testing
The second round of testing got underway in July 2017. Again the results were horrible, as the graphic below shows:
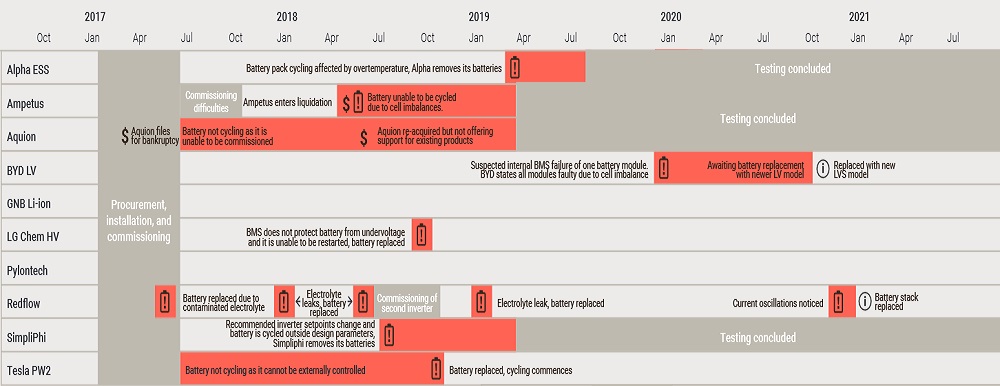
This is also from the Canberra Battery Test Centre and, once again, I squished it. But the good news is I didn’t have to squish it as much.
Of the 10 home batteries in Phase 2 testing, one failed to work at all, while only 2 didn’t break down in some way. Of the two that operated continuously, the GNB Li-ion suffered excessive battery deterioration and is currently at 47% capacity after the equivalent of 4.9 years of daily cycling. This leaves only 1 battery system out of 10 that managed to do what it was supposed to.
Pylontech US2000B:
This battery has worked well for over 4 years and so far has managed…
- Cycles: ~2,570. Equivalent to 7 years of daily cycling.
- Remaining capacity: 78%
While it has done well, it has already suffered more capacity loss than the Sony Fortelion, despite only being cycled 77% as much. So while as reliable as the Fortelion, this puts Pylontech in second place for all home batteries tested so far.
LG Chem HV:
This is another LG Chem battery system that failed. Its replacement is still being tested:
- Cycles: ~1,740. Equivalent to 4.8 years of daily cycling.
- Remaining capacity: 75%
It has managed to retain more capacity than the Phase 1 LG Chem LV. It’s currently on track to hit 60% capacity after the equivalent of 7.6 years of daily cycling.
Tesla Powerwall 2:
The testers discovered a faulty component in this battery soon after installation. This system developed another fault later, and it was replaced. It’s now operating well.
- Cycles: ~2,110 equivalent to 5.8 years of daily cycling.
- Remaining capacity: 79%
Phase 3 Testing
The 3rd phase of testing began in January 2020. As the graphic below shows, it did not go without a hitch:
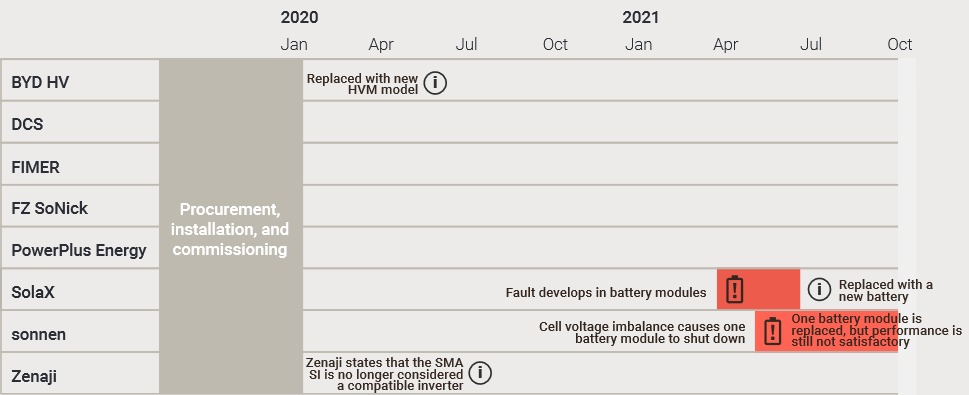
Once again, this graphic is from the Battery Test Centre, but this time I didn’t have to squish it! Yayyyyyyy!!!
But there were more hitches than the graphic indicates. While 4 batteries don’t have problems indicated, the PowerPlus Energy outputs considerably less energy per cycle than it should, while the DCS has suffered rapid capacity loss. This means only 2 of the 10 home batteries in Phase 3 testing was problem-free. They were the…
- FIMER REACT 2, and the…
- FZSoNick molten salt battery
Of the 7 lithium batteries — the type most likely to be used for home energy storage — only the FIMER REACT 2 worked as it should have.
Here’s a quick rundown on how the individual batteries performed, arranged in rough order from best to worst:
FIMER REACT 2:
This home battery system has so far operated without problem:
- Cycles: ~1,320 equivalent to 3.6 years of daily cycling.
- Remaining capacity: 88%
If its battery storage capacity continues to decline linearly at this rate, it will be at 67% after simulating 10 years of daily cycling. If this happens, it will take the 3rd place prize, just behind Pylontech, for the wondrous achievement of working as it should.
FZSoNick:
When I mentioned this battery in a previous article, I said its name reminded me of Fizzgig from the Dark Crystal, but these days I think of it as the Fozzie Bear battery. Anyway, moving right along…
[embedded content]
The FZSoNick battery is unique as the only sodium chloride metal battery tested. It uses molten salt at around 250ºC for its electrolyte but is well insulated, so the outer case only reaches a couple of degrees above air temperature. It has the disadvantage of needing to be discharged down to 0% every week. No information is given on how this affects overall efficiency. So far, it has done well at maintaining capacity:
- Cycles: ~760 equivalent to 2 years of daily cycling.
- Remaining capacity: 98%
These batteries apparently don’t lose capacity with use so — fingers crossed — it may remain at 98% for the rest of its life. These Swedish batteries charge and discharge much more slowly than lithium batteries, so completely cycling them in a day will be difficult for a home to achieve.
I think the chances of molten salt batteries being used for home energy storage in the future are very low, but I’ve been wrong before so take that statement with a grain of molten salt.
BYD B-Box HVM:
This home battery suffered a fault the month after it was installed and another the month after that. Fortunately, BYD was able to assist in getting it working again each time. After these initial problems, it has performed well:
- Cycles: ~790 equivalent to 2.2 years of daily cycling.
- Remaining capacity: 98%
The breakdowns mean it failed to work as it should have, but so far its capacity loss has been low. More time is needed to see if it will stay low.
SolaX Triple Power:
This operated for over a year before suffering problems, and SolaX replaced it with a new battery system. The new one is working well but has only been tested for a short time. The original managed the following…
- Cycles: ~880 equivalent to 2.4 years of daily cycling.
- Remaining capacity: 88%
This suggests it would be at 60% after around 8 years of daily cycling. Fingers crossed the replacement does better.
PowerPlus Energy LiFe Premium:
This PowerPlus Energy battery doesn’t have a direct communications link to its inverter. This means the inverter controls the battery ‘open-loop’ without the benefit of closed-loop feedback from the battery. While this setup can work well, previous Test Centre results have shown it often doesn’t.
In this case, the Test Centre has problems accurately measuring the battery’s charge. Its warranty states it can’t be discharged below 20%, so being uncertain of the actual charge means this limit could be breached accidentally. The battery system has been providing less energy than its specified usable capacity each cycle and generally only discharges around 5 kilowatt-hours when it should be capable of delivering around 7.9. While the cycle and remaining capacity figures for all the home batteries are estimates, these figures are more estimatey than most:
- Cycles: ~790 equivalent to 2.2 years of daily cycling.
- Remaining capacity: 95%
sonnenBatterie:
This operated for over a year without problem but then suffered a rapid decline in capacity. Sonnen replaced a battery module and reported one of its cells was defective. Replacing the module temporarily improved capacity, but the decline continued. COVID restrictions have apparently delayed fixing the problem. The graph below shows it operated well before the rapid decline, as well as the temporary improvement from the module replacement:
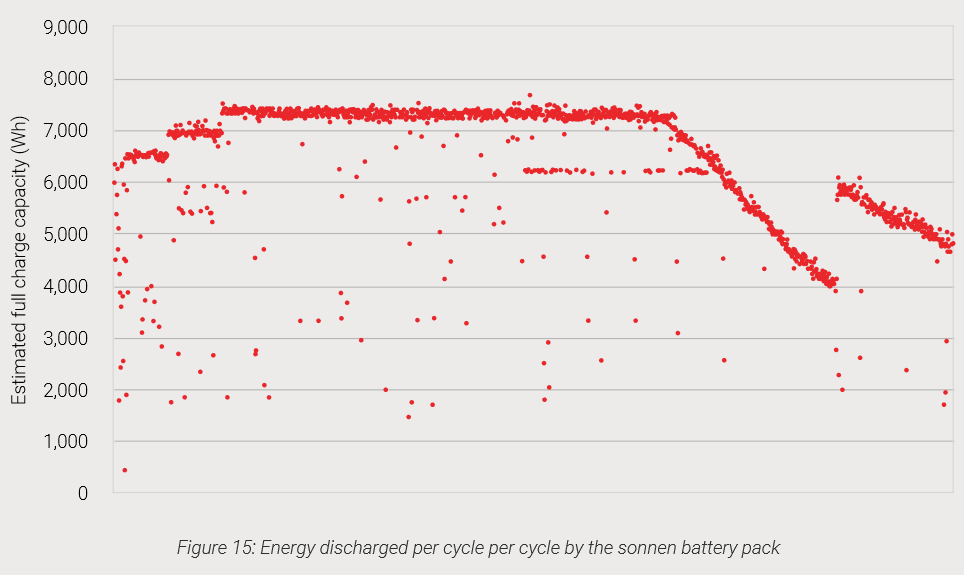
As the graph indicates, for the first 800 cycles, the sonnenBatterie showed no noticeable capacity deterioration.
Deep Cycle Systems (DCS) PV10.0:
This is another home battery that doesn’t directly communicate with its inverter. The DCS also supplied less energy per cycle than it should be able to. The Test Centre found it difficult to accurately measure how much charge the battery system has, but its capacity appears to be deteriorating rapidly:
- Cycles: ~880 equivalent to 2.4 years of daily cycling.
- Remaining capacity: 73%
If it continues at this rate, it will be down to 60% capacity after around 3.5 years of simulated daily cycling.
Zenaji:
This battery also does not have a communications link with its inverter. The SMA Sunny Island inverter it was paired with was one Zenaji recommended, but it hasn’t been able to accurately measure the amount of charge in the battery system. This has resulted in the battery generally supplying less than half the energy per cycle it should be able to. The Test Centre has been unable to estimate how much its battery capacity may have degraded.
Zenaji has since removed the SMA Sunny Island from its list of compatible inverters, but too late for the Canberra Battery Test Centre. Fortunately, households are protected by Australian Consumer Guarantees that require goods to be “fit for purpose”. This means if you are in the process of buying home battery storage from any provider and they say it will work with an inverter and it doesn’t, you are entitled to a remedy. This could be a repair, a refund, or a replacement.
Phase 3 Capacity Loss
Lithium battery capacity declines with use, and there’s also a slight loss over time if it’s not used. I expect accelerated testing to cause modestly higher capacity loss than regular household use due to the higher average charge and discharge rate. But because it is accelerated, it should result in less loss due to time passing. While not a perfect simulation of real life, it’s close enough to serve as a good guide.
It’s not possible to conclude much about the capacity off of the Phase 3 batteries because…
- Most had operational problems with capacity loss
- Only 1 was cycled over 1,000 times.
If you want reasonably accurate information on capacity loss you’ll need to wait for future reports. Even if a home battery system is cycled over 1,000 times it’s still possible for its capacity to suddenly fall off a cliff. But because people will want to know the results even though they can’t be relied on, I’ve put them in a graph.
While I could copy and paste the Test Centre’s graphs that draw lines through dots to extrapolate possible future capacity, I decided it would be more useful to show much battery storage capacity will remain after 10 years of daily cycling if current trends continue linearly:
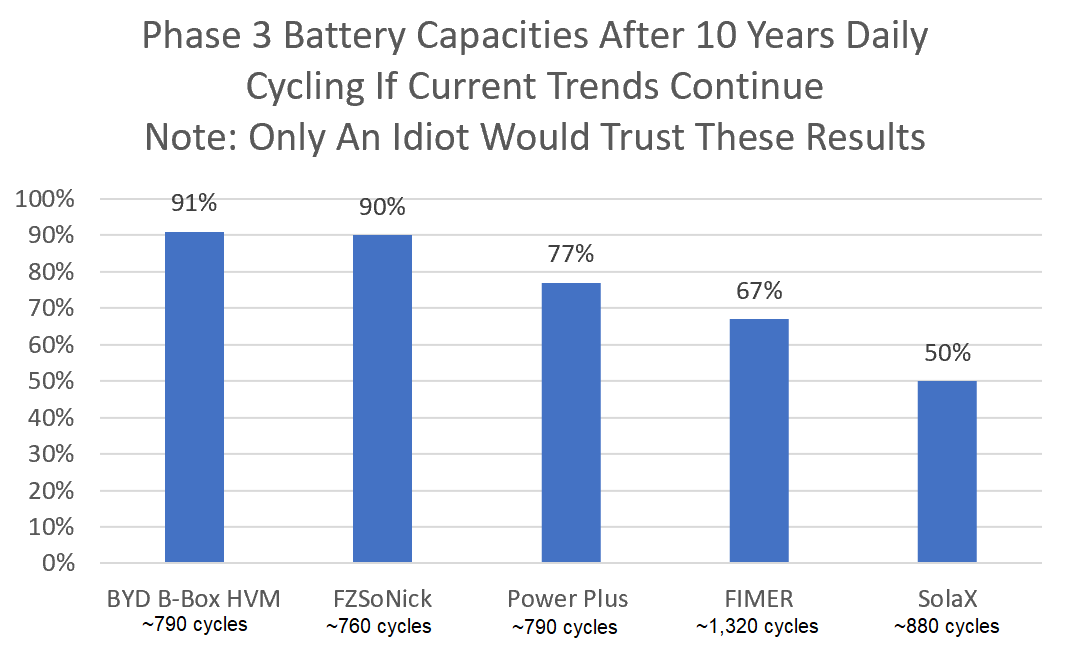
The sonnenBatterie and Deep Cycle Systems (DCS) aren’t on the graph because at their current rate of capacity loss they’ll be at 0% before 10 years have passed. I presume their rapid declines result from faults and not how the battery packs would behave in normal operation.
Under real-life conditions, battery capacity usually doesn’t decline at a steady rate down to 0%. Many home batteries, at some point below 60% capacity, will begin to decline rapidly. Then the battery system fails. Sad face.
Phases 1, 2, & 3 Capacity Loss
The Canberra Battery Test Centre has tested a total of 25 batteries. They tried to test 26, but one — Aquion — never worked at all. This doesn’t include replacement batteries, which would take the number up to 38. Many of the batteries did not survive long enough to be cycled 1,000 times. Around 10 managed to beat this number of cycles under their standard test conditions while providing enough information to estimate their capacity loss.
If the average deterioration established across these 1,000+ cycles were to continue for 10 years of daily cycling, then the capacity remaining at that time would be:
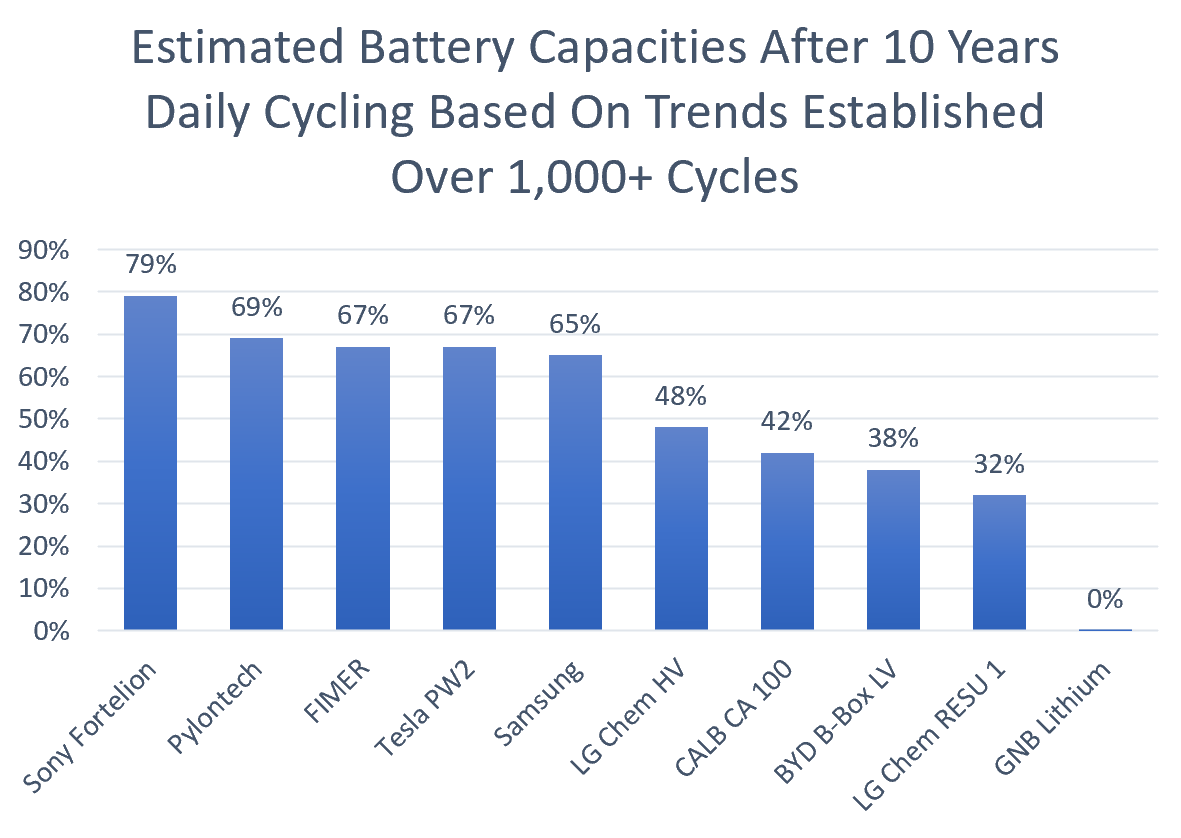
As the graph above shows, half would have managed to remain above 60%, while half would have done much worse — with one not even making it to 10 years. I would want a home battery that doesn’t fall under 60% of its original capacity after the equivalent of 10 years of daily cycling.
But note each result is from just a single battery. A good result means the battery can do well, but a bad result doesn’t mean the average performance of the latest version of that battery system will be as bad. Of course, a new home battery may do even worse.
Round-Trip Efficiency
The round-trip efficiency is how much electrical energy you can get out of a home battery compared to how much went in. For example, if a battery system has a round-trip efficiency of 90%, it’s necessary to put 10 kilowatt-hours in to get 9 kilowatt-hours out. Obviously, the higher the better.
Of the 26 batteries the Test Centre has gotten their hands on, they have been able to provide round-trip efficiencies for 15 of them. Unfortunately, they didn’t provide percentages but only provided a graph. So I did the graphical equivalent of holding a ruler up to my screen to determine the percentages for the graph below.
It is possible my figures are off by a percentage point from the actual figures the Test Centre determined but didn’t directly provide. Nevertheless, the round-trip efficiencies are better than I expected, given they are charged and discharged at a higher rate when tested than the average for household use.
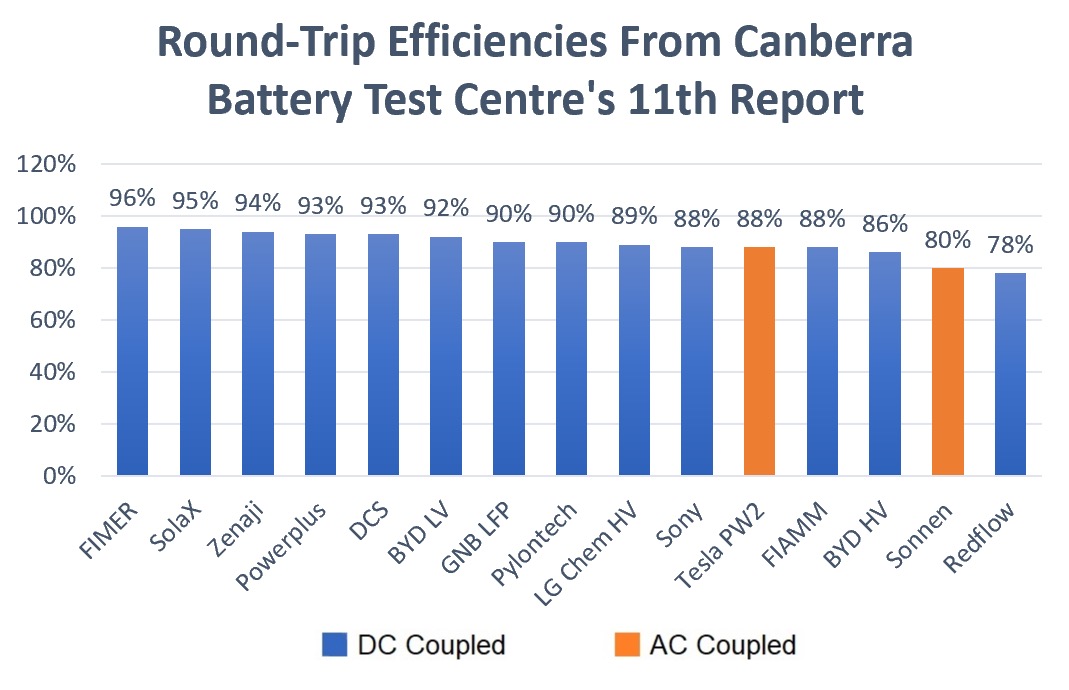
The blue bars on the graph are DC coupled home batteries. These usually are slightly more efficient than AC coupled ones, but the Tesla Powerwall 2 does well with an efficiency of 88%. The only other AC coupled battery, the sonnenBatterie, did surprisingly poorly at 80%. This is the lowest of all the lithium batteries tested and not much better than the Redflow, which has low efficiency thanks to its zinc bromide chemistry. The sonnenBatterie’s fault may have affected its efficiency, but this may not be the case as it worked well for over a year.
If You Have A Home Battery, Check It’s Working Well
The lousy Test Centre results make me think there may be many installed batteries currently under-performing in some way. If you have a home battery, I recommend checking it’s working as it should and contacting your installer if it’s not.
If it’s working well enough to suit you for the moment, you may not think there’s a problem. But if something’s a little off, there may be an issue that’s easily fixed now but could become a disaster if nothing is done.
Home Batteries & Consumer Guarantees
The apparent low reliability of home batteries makes Australian Consumer Guarantees very important. Not only must products work as promised, but they also have to perform as they would reasonably be expected to. For example, it’s reasonable to expect a home battery to work all the time and not half the time. A battery storage provider can’t weasel out of their responsibilities by saying this wasn’t something they specifically promised.
Importantly, Consumer Guarantees apply regardless of what the written warranty states. So, for example, manufacturers can’t hide in the small print that a battery system needs to be regularly serviced by a qualified technician and then claim they don’t have to fix problems because you didn’t do that.
Products must also be fit for purpose. If you tell an installer you want a battery system that can power specified appliances in your home for 24 hours through a blackout and what they sell you can’t do that, you are entitled to a repair, a refund, or a replacement. In this case, a repair would involve making the system capable of providing 24 hours of backup.
If the installer you bought the battery system from goes out of business, the manufacturer’s warranty still applies. If the manufacturer has an Australian office, they are responsible for it, and if they don’t have an office, the importer is responsible. As some very dodgy people describe themselves as “importers”, I recommend checking just who is responsible for the manufacturer’s warranty before buying.
Caveat Emptor
“Caveat emptor” is Latin for “buyer beware”. We are protected by Australian Consumer Guarantees, so we don’t have to be as beware as in some countries, but if you want to have a good home battery storage experience and avoid stroking out from high blood pressure brought on by a crap battery installation, I strongly recommend the following:
- Buy a battery from a manufacturer with a reputation for quality and readily providing repairs and replacements when required.
- Check who is responsible for the manufacturer’s warranty. In most cases, it will be a large overseas company with an office in Australia. But if you like living dangerously, it could be an Australian importer.
- Only use an installer who does top quality work with an excellent reputation for customer service when it comes to fixing any problems. This is not going to be the cheapest installer you can find.
- Make sure both you and the installer are clear on what you expect from the battery system before installation. This can include usable energy storage, continuous power output, backup capability, capacity loss over time, and so on.
This won’t guarantee your home battery won’t have problems, but it pays to take these precautions.
One Day My Battery Storage Optimism Will Pay Off
I’m optimistic about the future of home batteries. I’m certain reliability will improve, and prices will fall. We know battery packs can operate safely and reliably. Nearly 80% of new cars sold in Norway are electric, and the country is not ablaze with lithium battery fires or people attempting to thumb rides from passing Viking ships because their cars don’t work.
[embedded content]
Some good news is the Phase 3 batteries were sourced 2 years ago now, so hopefully, there have been reliability improvements since then.
If we are to have cost-effective home battery storage, reliability will have to improve because it’s simply too expensive for providers to go around fixing and replacing so many of them.
It’s possible BYD, LG Chem (now LG Energy Solution), Tesla — or even another large manufacturer that doesn’t have anything at the Canberra Battery Test Centre such as Huawei — have reached this point, and the number of repairs and replacements they have to perform is down to a reasonably low level.
But we will need more than one large company to reach this point for competition to drive down the cost of home batteries and make energy storage a standard feature in Australian homes.
Original Source: https://www.solarquotes.com.au/blog/home-battery-testing-results/
Related Posts:
 SimpliPhi completes UL 9540A fire safety tests
- Best Home Batteries In 2021? The Brands Top Solar…
- Home Batteries Finally Taking Off?
- Beating Blackouts: 4 Levels Of Home Battery Backup
- Canberra Battery Test Centre Final Report: Only 1 Of…
- Canberra Battery Test Centre Phase 3 Results: Zero…
- Panasonic offers warranty bundle for customers…
- Australians Back National Home Battery Subsidy


